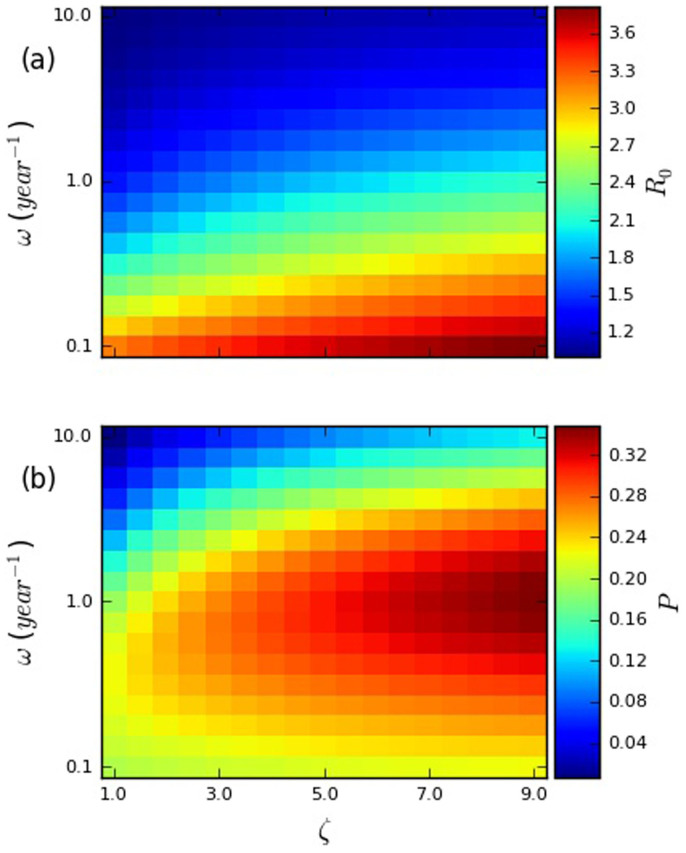
Figure 1. Heatmaps plotting (a) the basic reproduction number (R0), and (b) equilibrium prevalence (P) against the relative transmissibility during early HIV infection (ζ) and re-selection rate (ω).
The per-act transmissibilities during EHI and chronic infection for each parameter set were chosen based on the constraints that (1) their ratio must be ζ and (2) the total transmission potential in a homogeneous system must be the same for all parameter sets. This transmission potential was chosen by setting the endemic prevalence for the lower-left parameter set to be 0.2. The other parameters used are summarized in Supplementary Table 1 in §2 of the Supplementary Information. Each panel has a scale that runs from the lowest to the highest value observed in that panel.

