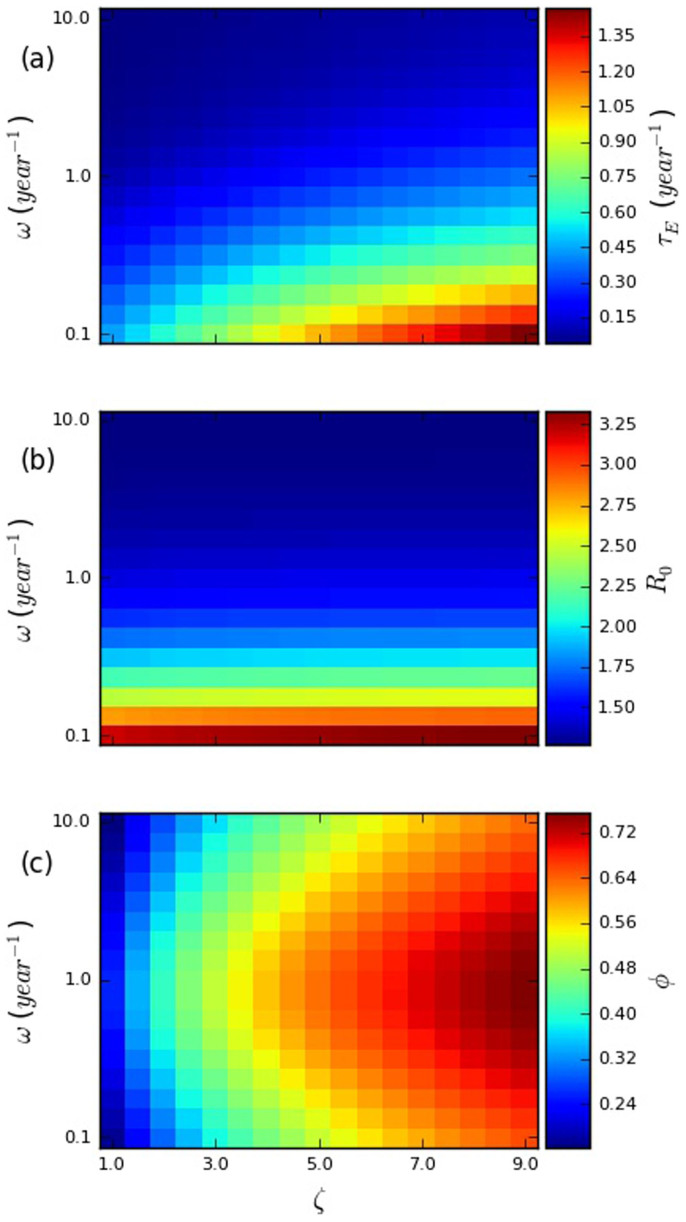
Figure 2. Heatmaps plotting (a) the effective treatment rate required to achieve elimination (τE), (b) the basic reproduction number (R0), and (c) the fraction of transmissions from early HIV infection (φ) against the relative transmissibility during early HIV infection (ζ) and re-selection rate (ω).
The other parameters used are summarized in Supplementary Table 1 in §2 of the Supplementary Information. Each panel has a scale that runs from the lowest to the highest value observed in that panel.

