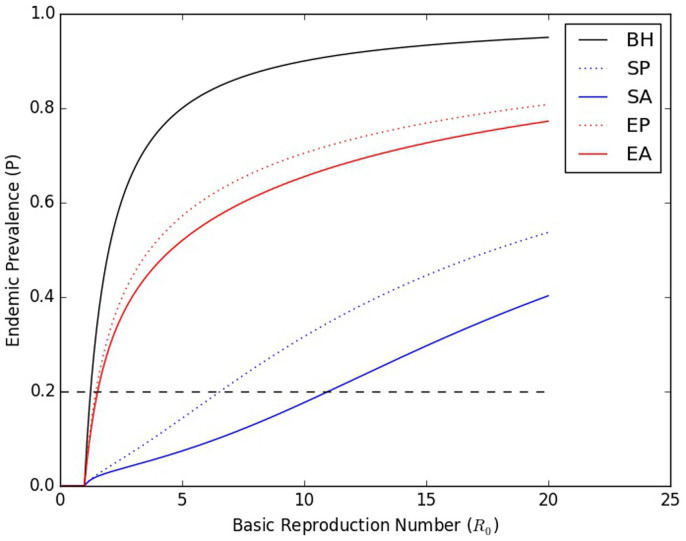
Figure 3. Curves showing the prevalence as a function of R0 when all parameters except the overall transmissibility are held constant.
The curves shown are for the full (maximal) model (episodic risk, with assortative mixing (m = 0.5) – EA), and several reduced models: Episodic risk, with proportional mixing (EP, the primary model in this paper); Static risk heterogeneity, with assortative mixing (m = 0.5) (SA); Static risk heterogeneity, with proportional mixing (SP), and Behavioral Homogeneity (BH). The formulation of these reduced models is discussed in more detail in §3.5 of the Supplementary Methods. The dashed black line indicates a constant prevalence of 0.2, illustrating the drastically different values of R0 that are possible when the prevalence is fixed.

