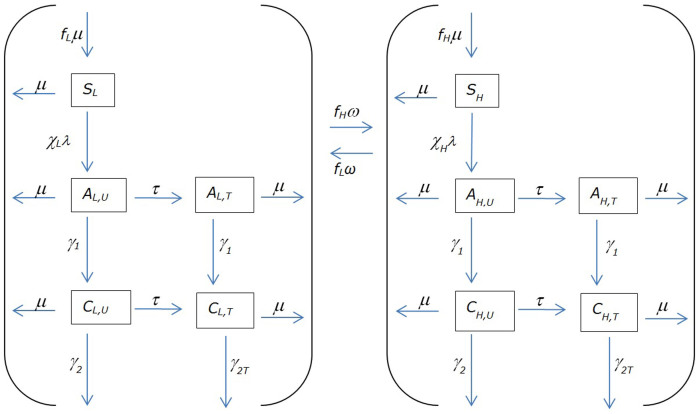
Figure 5. Dynamics of acquisition, progression, and treatment of infection.
The meanings of symbols representing subpopulations are given in Table 1, and the meanings of symbols representing parameters (including derived parameters) are given in Table 2. Note that only re-selections resulting in transition to the other risk group are shown; loops depicting re-selections that place the individual in the same risk group (and therefore same compartment) they were in prior to re-selection are not included.

