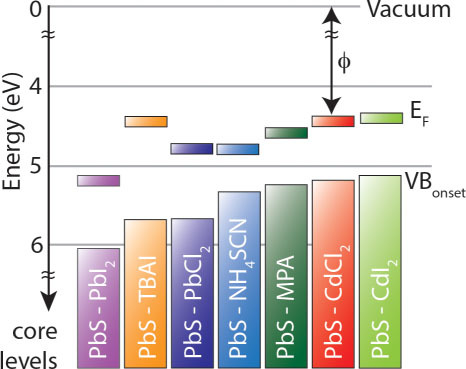
Figure 2. Summary of photoelectron spectroscopy results of 1.3 eV bandgap PbS QDs with various surface treatments.

The EF - EVB onset and ϕ of PbS QDs changes with PbI2, TBAI, PbCl2, NH4SCN, MPA, CdCl2, and CdI2 surface treatments/ligand exchange.

The EF - EVB onset and ϕ of PbS QDs changes with PbI2, TBAI, PbCl2, NH4SCN, MPA, CdCl2, and CdI2 surface treatments/ligand exchange.