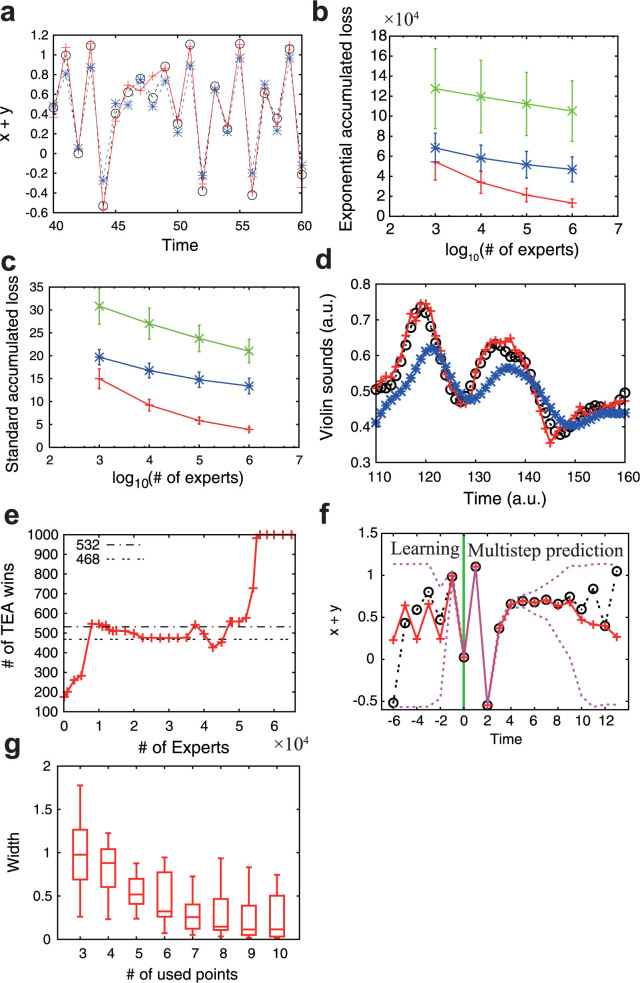
Figure 2. Examples of prediction by TEA.
(a) Online point prediction of the Hénon map. (b, c) The number of experts versus the exponential accumulated loss of errors and the standard accumulated loss of errors in the prediction of the Hénon map. (d) Online point prediction of violin sounds. (e) The number of experts versus the number of wins out of 1,000 online prediction trials against the persistence prediction in the violin example. (f) Distribution prediction of the Hénon map. (g) Confidence interval width against the number of used points shown in box plots. In panels (a) and (f), actual observations are shown with black ○ and dotted lines, TEA predictions are shown with red + and solid lines, and the prediction given by the method of Chernov and Zhdanov is shown with blue * and dashed lines. In panel (f), the purple dotted lines show the 95% confidence interval of the distribution prediction, and the green line divides the learning period and the multistep prediction period. In panels (b) and (c), red, blue, and green error bars correspond to TEA, the method of Chernov and Zhdanov, and the standard expert advice, respectively. In panel (e), the dotted lines show the 95% confidence interval under the null-hypothesis of even chance.

