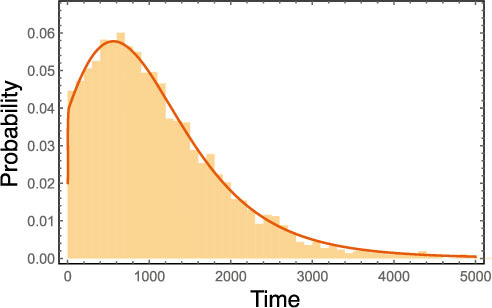
Figure 2. Time distribution of reaching the final mutant for a four type fitness landscape as in Fig. 1.

Solid line represents the recursive solution and the bars represent 5000 simulations. The parameters are: Death probabilities: dab = 0.5, dAb = 0.49995, daB = 2/3, dAB = 0.25. Birth probabilities are 1 minus the corresponding death probability. Mutation probabilities are  , μA = 2⋅10−5,
  . Population size in the beginning: N = 30000.
