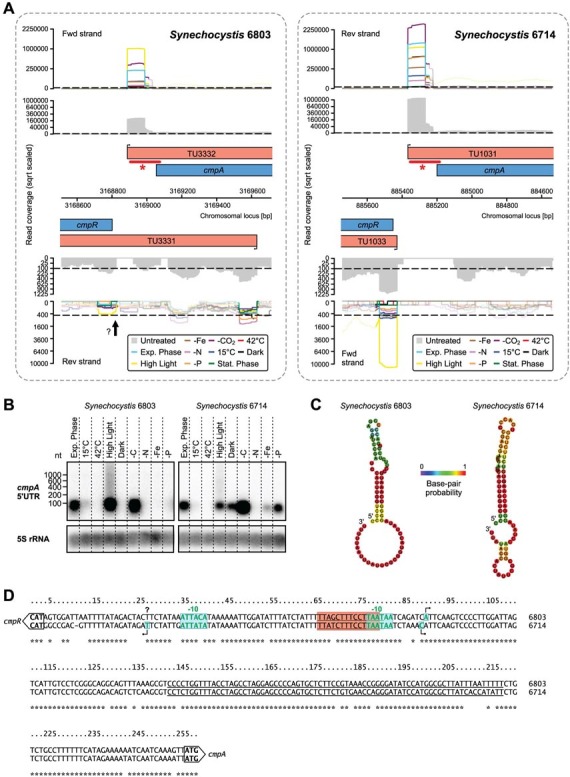
Figure 2. Differences in the expression of CmpR, a LysR family transcription factor involved in the control of carbon uptake and concentration.

(A) Transcriptional organization in the intergenic region between cmpA and cmpR. The color-coded graphs represent the accumulation of primary reads in the dRNA-seq analysis for the ten compared conditions. From the TSS identification and secondary read coverage (grey), transcriptional units (TUs, red) were inferred. Protein-coding genes are displayed in blue. A gTSS upstream of cmpR in strain 6714, but below the detection limit in strain 6803, is indicated by an arrow. Positions of 32P-labelled probes for Northern verification in panel (B) are marked by asterisked bars. The dashed lines mark the thresholds for the required minimum sequence coverage. (B) Northern verification for cmpA that shows accumulation of a distinct, small transcript from the 5′UTR. The signal for the 5S rRNA was used as a loading control. (C) Potential RNA terminator hairpins upstream of cmpA between −39 to −114 (+1 = first nucleotide of the cmpA start codon). (D) The cmpA/cmpR intergenic region harbouring the promoters for both genes. The underlined sequence was used for the RNA structure prediction in panel (C). The red box indicates putative cmpR binding sites consistent with the consensus motif TTA-N7/8-TAA described for Synechococcus sp. PCC 794230. The entire region is almost identical in both strains, except a small number of single nucleotide exchanges, one of which is in the −10 element (boxed + green letters) and probably linked to the observed weaker cmpR promoter activity in Synechocystis 6803.
