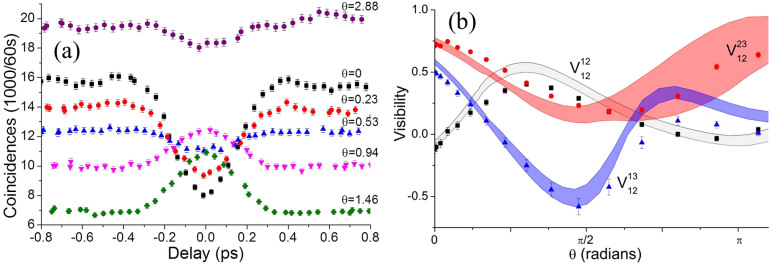
Figure 3. (a) Two-photon coincidences as a function of relative delay at various values of phase θ injecting into inputs 1 and 2 and measuring at outputs 1 and 3.
(b) Measured (points) and predicted (bands) two-photon visibilities as a function of θ when injecting |110〉. Black squares:  , red circles:
  , blue triangles:
  . Grey band: predicted upper and lower bounds for
  , red band: predicted bounds for
  , blue band: predicted bounds for
  .
.

