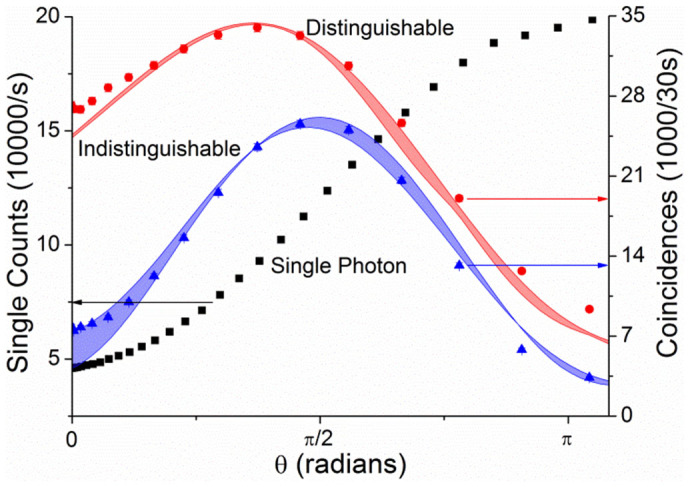
Figure 4. Measured single and coincidence counts as a function of phase.

Black squares and left axis: single counts injecting into port 1 and measuring at port 1. Red and right axis: measured (circles) and predicted (band) coincidence counts at outputs 2 and 3 when injecting into ports 1 and 2 at maximal distinguishability. Blue and right axis: measured (triangles) and predicted (band) coincidence counts at outputs 2 and 3 when injecting into ports 1 and 2 at minimal distinguishability.
