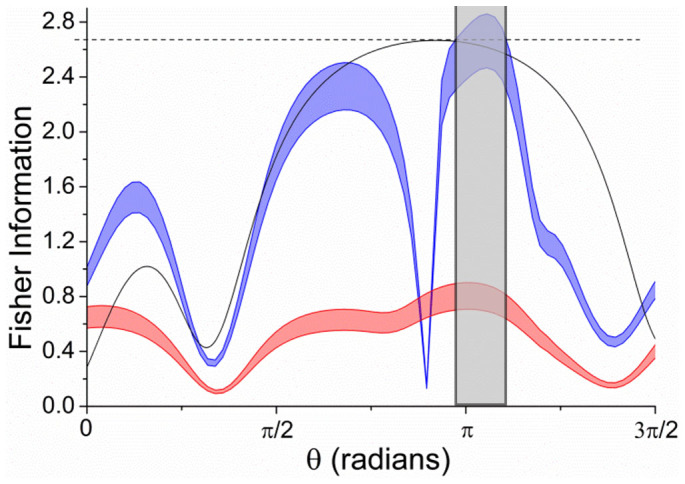
Figure 5. Extracted Fisher information of the three-arm interferometer when injecting |011〉 (blue curve) and single photons (red curve).

Grey shaded region: values of the phase θ where the theoretical limit for an ideal three-path interferometer lies within the tolerance limit of the extracted Fisher information. The Fisher information calculated for an ideal, symmetric device with a two-photon input state is plotted (black curve) for comparison.
