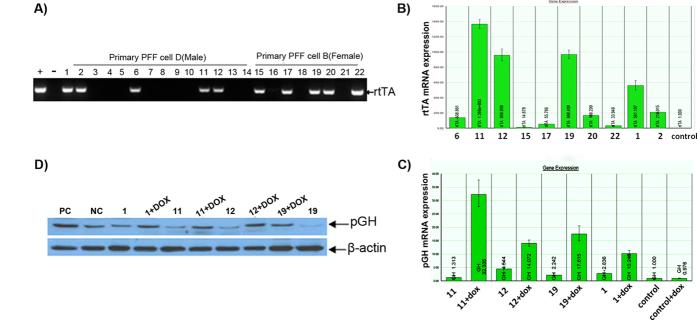
Figure 2. Identification and induction of transgenic donor cell clones.
A) rtTA gene detection in genomic DNA of G418 positive PEF cell lines. Lane M, DL2000 DNA marker; positive control (+, PC) and negative control (−, NC) using pTTGH plasmid DNA and untransfected PEF cell genomic DNA as templates, respectively. B) QRT-PCR analysis of rtTA expression in rtTA integrated cell clones. The cell clones with the highest rtTA mRNA expression levels are circled. C) Real-time PCR analysis of pGH mRNA expression in cell clones before and after DOX induction. The pGH mRNA expression levels in PEF cell clones NO.11 and NO.19 have low basic pGH expression levels and higher induction efficiency. D) Western blot analysis of pGH protein expression in cell clones before and after DOX induction. The positive control (PC) was the cells transfected with pcDNA-GH plasmid; the negative control was the normal cells. The gradation analysis method was used to compare the pGH induction and expression efficiency in PEF cell lines. The blots have been cropped to focus on the bands of interest. See Supplementary Fig. S2-3 for full-length gels.

