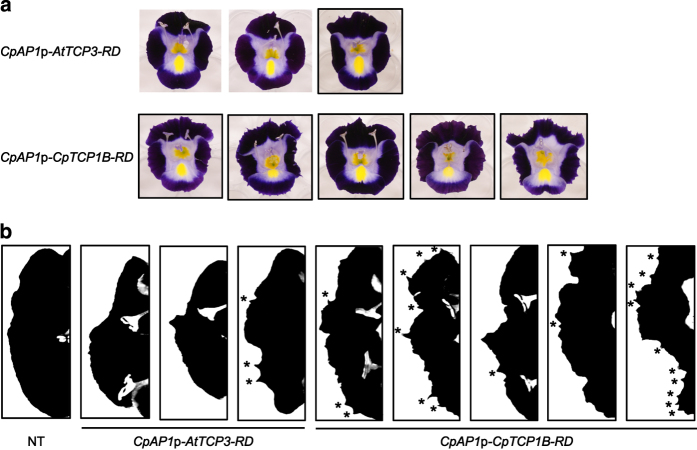
Figure 4.
Comparison between the effects of AtTCP3-RD and CpTCP1B-RD. (a) Phenotypes of three CpAP1p-AtTCP3-RD lines and five CpAP1p-CpTCP1B-RD lines. (b) Silhouettes of the top lobes of the non-transgenic line, CpAP1p-AtTCP3-RD lines, and CpAP1p-CpTCP1B-RD lines. Serrations are indicated by asterisks. The silhouettes of the transgenic lines correspond to the flowers shown in (a) in the same order.

