Figure 5.
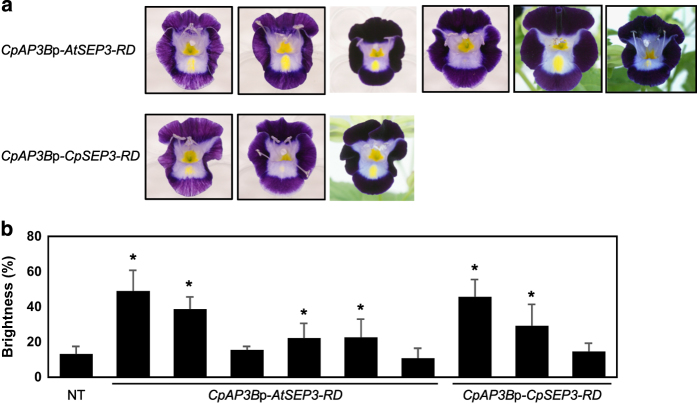
Comparison between the effects of AtSEP3-RD and CpSEP3-RD. (a) Phenotypes of six CpAP3Bp-AtSEP3-RD lines and three CpAP3Bp-CpSEP3-RD lines. (b) Brightness of the lobes measured in the non-transgenic line, CpAP3Bp-AtSEP3-RD lines, and CpAP3Bp-CpSEP3-RD lines. The data represent the mean and standard deviation (n=8). Asterisks indicate significant differences from the non-transgenic line by Student’s t-test (P<0.05). The data for transgenic lines correspond to flowers shown in (a) in the same order.

