Figure 8.
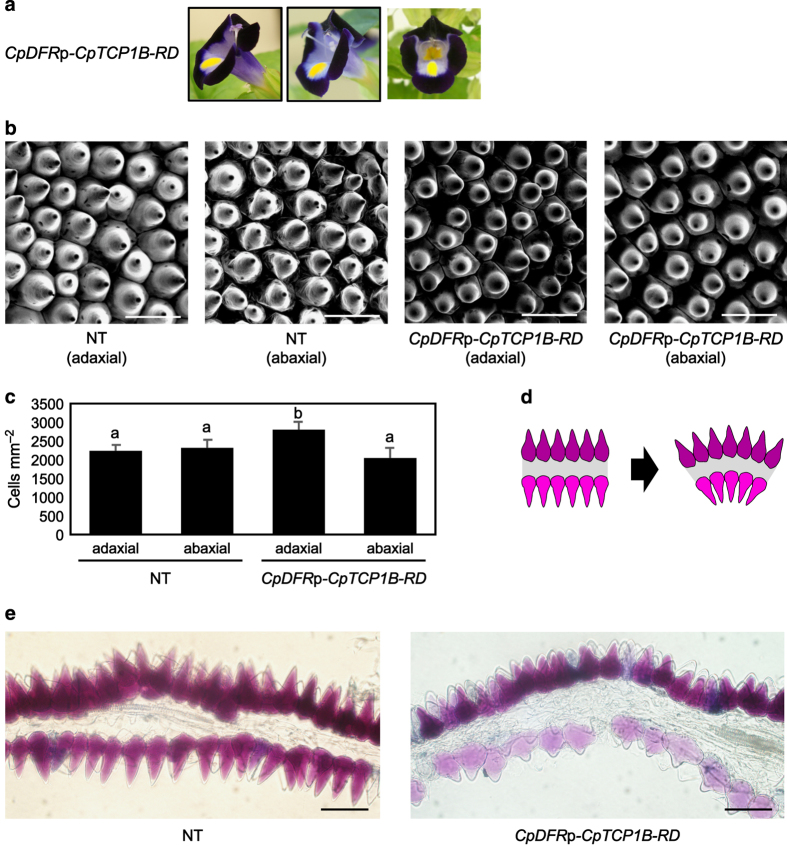
Microscopy analysis of CpDFRp-CpTCP1B-RD lines. (a) Phenotypes of three CpDFRp-CpTCP1B-RD lines. (b) Conical cells of the petals imaged via scanning electron microscopy on the adaxial/abaxial sides of the non-transgenic line and curled CpDFRp-CpTCP1B-RD line. (c) Conical cell density on petal surfaces. The data represent the mean and standard deviation (n=4). The values labeled with different letters (a or b) are significantly different from each other by Student’s t-test (P<0.05). (d) Schematic representation of the effect of differential cell densities. (e) Cross-section of the lobe of the non-transgenic line and curled CpDFRp-CpTCP1B-RD line. Bars=50 μm in all images.

