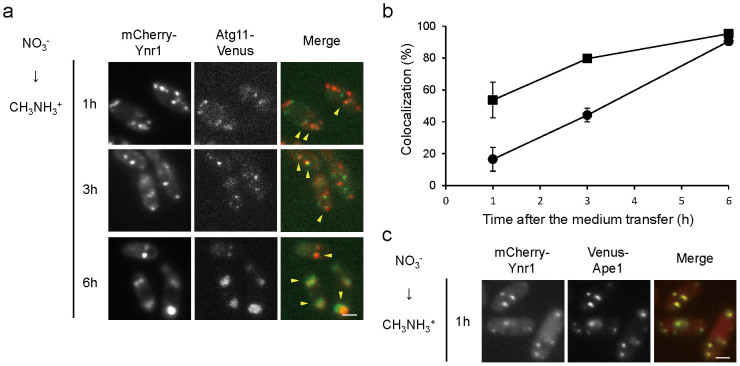
Figure 6. Sequestration and transportation of Ynr1 via the Cvt pathway after the shift from nitrate to methylamine.
(a) Microscopic images of C. boidinii wild-type cells expressing Atg11-Venus and mCherry-Ynr1. The cells were subjected to the nitrogen-source shift from nitrate to methylamine. Yellow arrowheads indicate co-localization of Atg11-Venus and mCherry-Ynr1. Merged images are combined images of Venus green fluorescence and mCherry red fluorescence images. Bar, 2 µm. (b) Quantitation of co-localization of Atg11-Venus and mCherry-Ynr1 in the C. boidinii wild-type strain used for the microscopic imaging analysis shown in (a). Percentages represent the ratio of the number of co-localized puncta to the number of Atg11-Venus puncta or mCherry-Ynr1 puncta. Symbols:  , ratio of the number of co-localized puncta to the number of Atg11-Venus puncta;
  , ratio of the number of co-localized puncta to the number of mCherry-Ynr1 puncta. For each sample, a minimum of 50 cells was analyzed. Error bars show standard deviations of dot measurements of all cells. (c) Co-localization of Venus-Ape1 and mCherry-Ynr1 in wild-type cells 1 h after the nitrogen-source shift from nitrate to methylamine. Yellow arrowheads indicate co-localized puncta. Bar, 2 µm.

