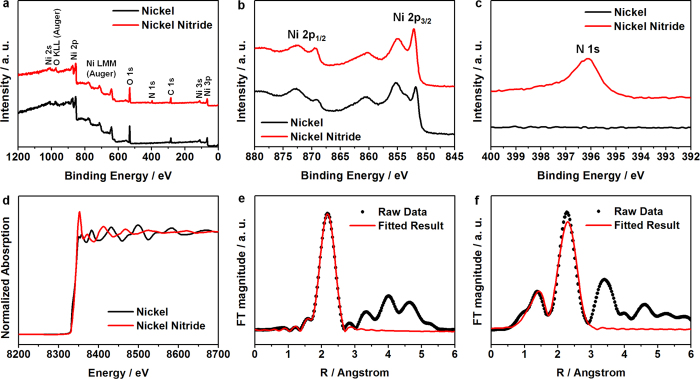
Figure 3.
(a) XPS spectra of the nickel (black lines) and nickel nitride (red lines) films across a wide scan range for (b) the Ni 2p core level peak, and (c) the N 1s core level peak. (d) The Ni K-edge XANES spectra of nickel and nickel nitride. (e,f) The k3-weighted Fourier transform of the EXAFS spectra at the Ni K-edge for (e) nickel and (f) nickel nitride.

