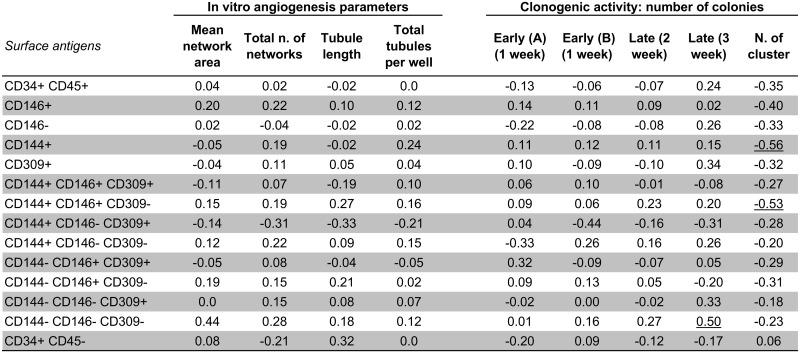
Fig 7. Correlation analysis (Spearman rho) of the differences (Δ = after minus before treatments) in angiogenesis and clonogenic activities (independent variable), and the differences (Δ = after minus before treatments) in surface antigens.
Abbreviations; AU = Arbitrary Units; Early (A) and early (B) = Hill colony analysis performed by two independent investigators. Only the underlined correlation coefficients were significant. Treaments = atorvastatin 80 mg + 80 mg, rosuvastatin 40 mg + 40 mg, rosuvastatin 10 mg + ezetimibe 10 mg.

