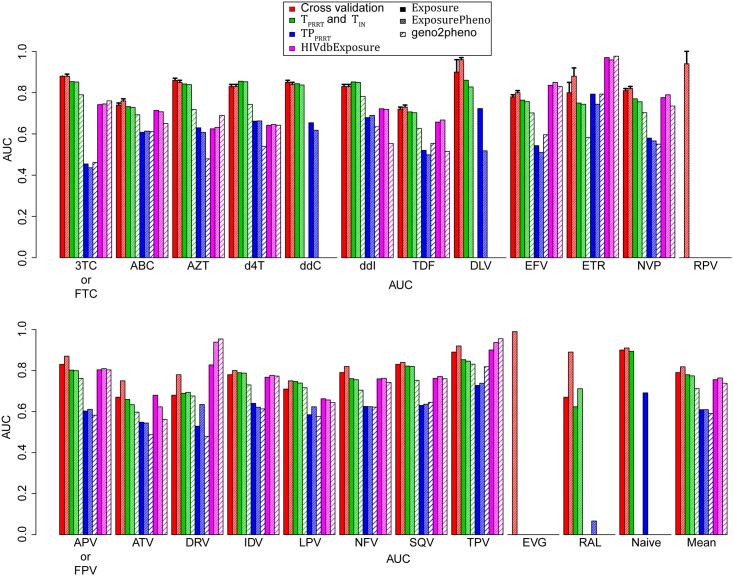
Fig 3. Performance of drug-exposure prediction.
Performance of drug-exposure prediction was assessed with 10-fold cross validation on the development set and four test sets. Test sets TPRRT and TIN were obtained from the EuResist database and contain protease and reverse-transcriptase and integrase sequences, respectively. TP is a subset of TPRRT ∪ TIN and contains nucleotide sequences that were measured during therapy pauses. HIVdbExposure was obtained from the HIVdb TCE repository and contains protease and reverse-transcriptase sequences. Performance on the test sets was compared to that of geno2pheno[resistance]. Bars depicting mean performances were calculated only using drugs that are common to Exposure and ExposurePheno models, as well as to geno2pheno[resistance]. Error bars indicate the standard deviation. 3TC: lamivudine, ABC: abacavir, AZT: zidovudine, d4T: stavudine, ddC: zalcitabine, ddI: didanosine, FTC: emtricitabine, TDF: tenofovir, DLV: delavirdine, EFV: efavirenz, ETR: etravirine, NVP: nevirapine, RPV: rilpivirine, APV: amprenavir, ATV: atazanavir, DRV: darunavir, FPV: fosamprenavir, IDV: indinavir, LPV: lopinavir, NFV: nelfinavir, SQV: saquinavir, TPV: tipranavir, EVG: elvitegravir, RAL: raltegravir.

