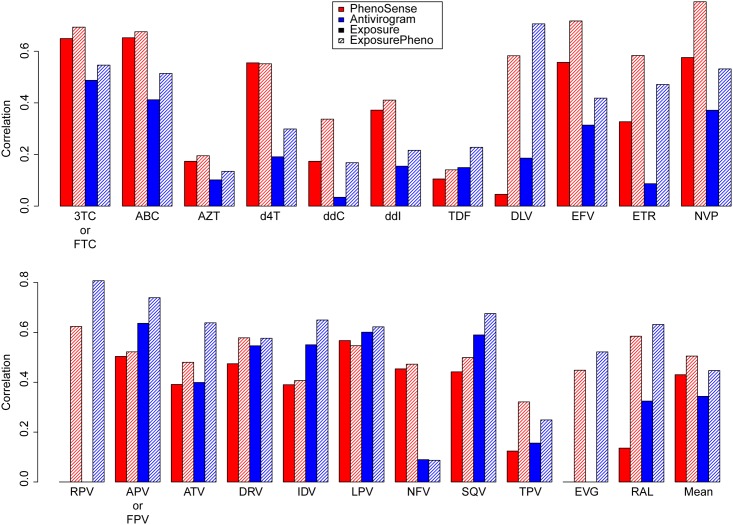
Fig 4. Correlation of drug-exposure scores with logarithmized resistance factors.
Genotypes in TPheno were interpreted with drug-exposure models. The correlation of the resulting drug-exposure scores with the corresponding logarithmized resistance factors is displayed above. Note that drug-resistance assays (either Antivirogram™ or PhenoSense™) are denoted by the colors of the bars, while the drug-exposure model types (Exposure or ExposurePheno) are denoted by the shading of the bars. Bars depicting the mean performances were calculated with the drugs for which Exposure and ExposurePheno models are available. Error bars indicate the standard deviation. 3TC: lamivudine, ABC: abacavir, AZT: zidovudine, d4T: stavudine, ddC: zalcitabine, ddI: didanosine, FTC: emtricitabine, TDF: tenofovir, DLV: delavirdine, EFV: efavirenz, ETR: etravirine, NVP: nevirapine, RPV: rilpivirine, APV: amprenavir, ATV: atazanavir, DRV: darunavir, FPV: fosamprenavir, IDV: indinavir, LPV: lopinavir, NFV: nelfinavir, SQV: saquinavir, TPV: tipranavir, EVG: elvitegravir, RAL: raltegravir.

