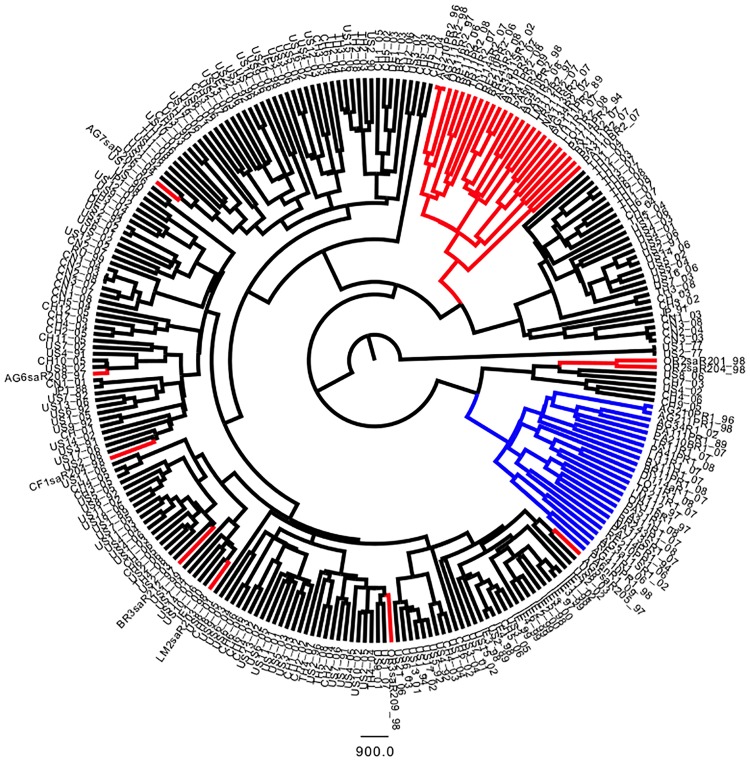
Fig 6. The origin of the R1 copy of the V3 region (in blue) differs from that of wild-type V3 regions (in black) at the world scale.
R2 copies (in red) have a common origin with wild V3. Ninety percent posterior probability tree inferred from BEAST analysis under the coalescent constant size model with a random relaxed uncorrelated lognormal clock.

