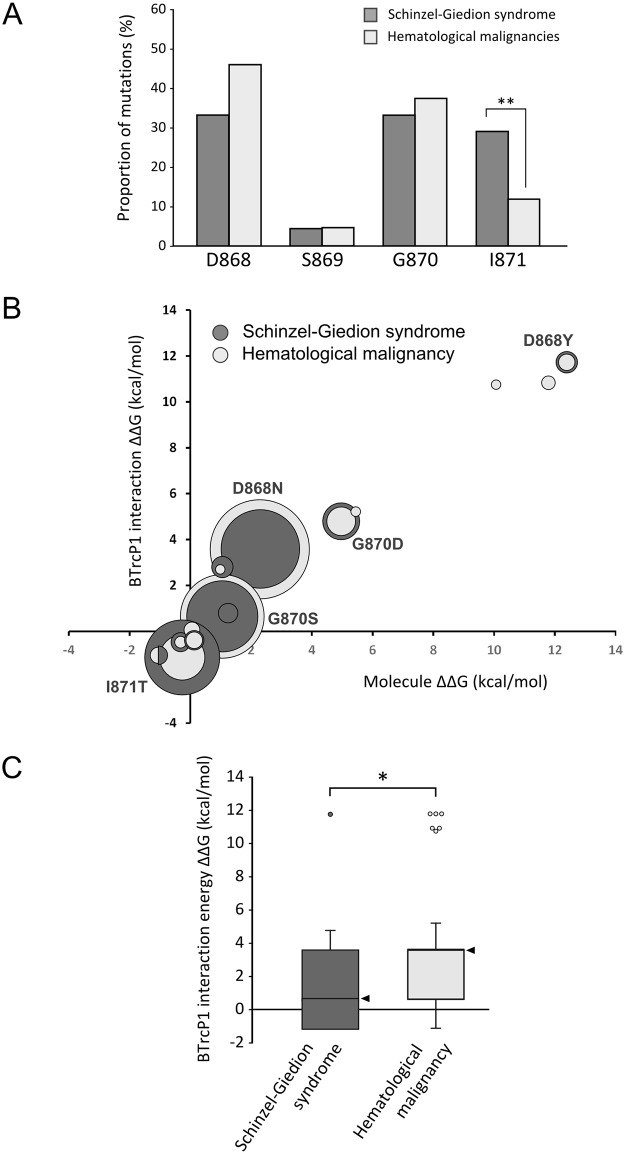
Fig 3. On average, SETBP1 mutations seen in cancer are more severe than those observed in SGS.
A. Distribution of mutations within the SETBP1 degron in SGS and in hematological malignancies. (** p<0.01, Fisher’s test and Bonferroni correction for multiple testing). B. ΔΔG values for protein stability (x-axis) and degron-βTrCP1 interaction (y-axis) for all mutations reported in SETBP1. The size of each circle is proportional to the frequency of the mutation in each condition. C. Difference in free energy of binding in the interaction between βTrCP1 and the degron of variants arising from germline or somatic SETBP1 mutations compared to that of the interaction between βTrCP1 and the wild-type degron (* p <0.05, Mann-Whitney’s U test). The median is highlighted by an arrow head.

