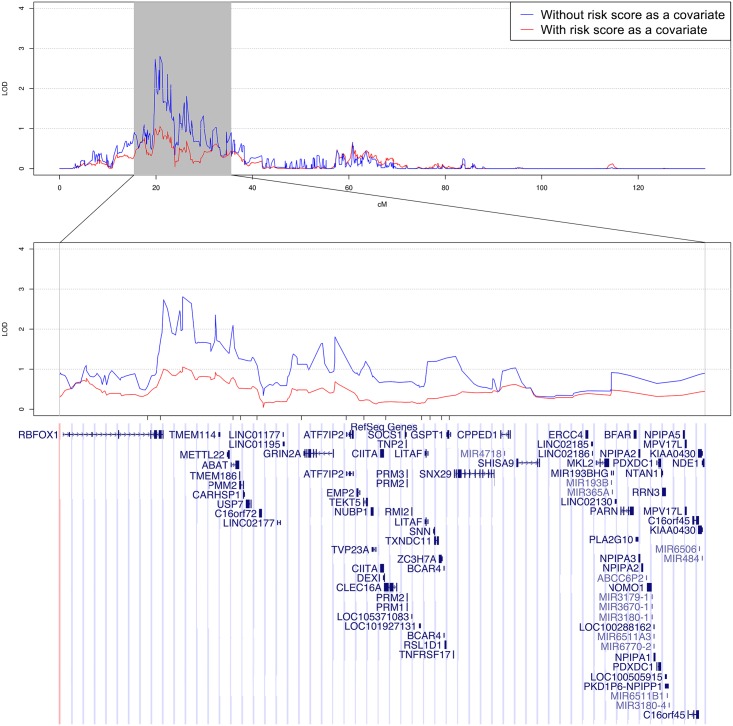
Fig 1. Linkage region on chromosome 16 of white participants in CFS.
Linkage peak on chromosome 16 for SBP. The linkage curves are plotted with (red curve) and without (blue curve) adjusting for the risk score defined by the 13 coding variants as a covariate. The positions of the 13 coding variants are listed under the linkage peak and above the genes.

