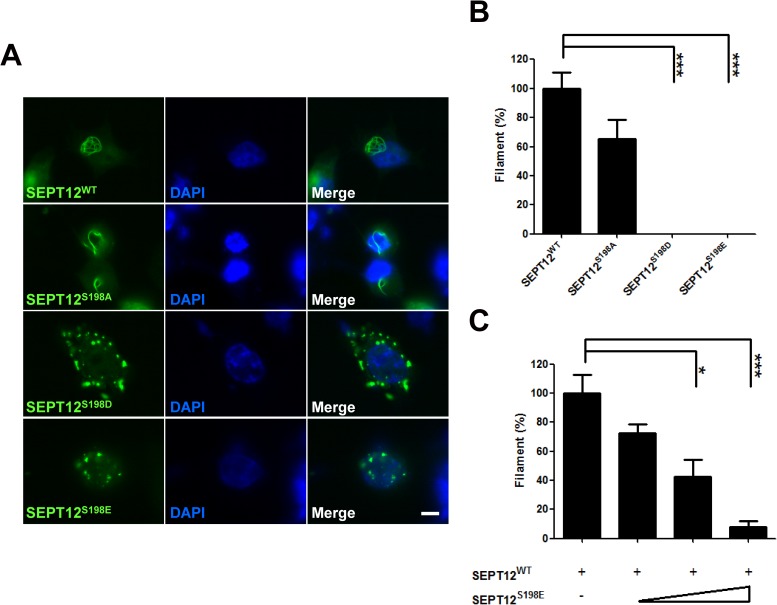
Fig 4. The expression patterns of mimetic phosphorylated Ser198 of SEPT12.
(A, B) The GFP-SEPT12WT, GFP-SEPT12S198A, GFP-SEPT12S198D, and GFP-SEPT12S198E plasmids were transfected into NT2/D1 cells. (A) Different patterns of GFP-SEPT12 are shown. Scale bar, 10 μm. (B) The percentage of NT2/D1 cells with GFP filament fibers. (C) Effect of mimetic Ser198 phosphorylation of SEPT12 on SEPT12 filament formation. A total of 1 μg of the GFP-SEPT12WT plasmid was mixed with 0, 1, 2 or 4 μg of the GFP-SEPT12S198E plasmid and transfected into NT2/D1 cells. In B and C, the quantification bar was based on the observation of more than 100 cells for each experiment, and cells with GFP filament fibers were counted. The data are represented as the means ± SEM (n = 3). * P < 0.05, and *** P < 0.001.

