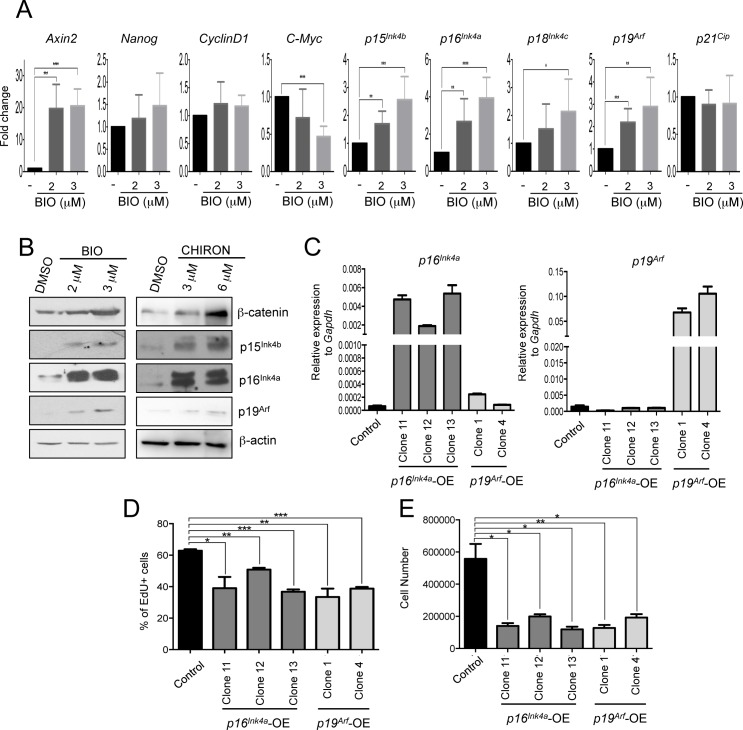
Fig 2. β-catenin stabilization by GSK3 inhibition increases expression of Tcf1 target genes in mESCs.
(A) Quantitative Real Time PCR (qRT-PCR) for Wnt targets (Axin2, Cyclin D1, C-Myc), stem cell (Nanog), and Tcf1 target cell cycle genes (p16Ink4a, p19Arf, p15Ink4b, p18Ink4c and p21Cip) in control and BIO-treated mESCs for 48h. (n = 6; BIO treated compared to DMSO treated mESCs). (B) Representative Western blot of β-catenin, p16Ink4a, p19Arf, p15Ink4b and β-actin, in 72h BIO and CHIR99021 treated mESCs. (C) qRT-PCR of p16Ink4a and p19Arf in mESC single clones infected for specific overexpression of p16Ink4a and p19Arf. Control cells were infected with empty vector. (D) Percentage of EdU positive (EdU+) in control, p16Ink4a and p19Arf overexpressing mESCs (p16Ink4a-OE, p19Arf-OE) 36h after plating (n = 3). Cells were incubated 40’ with EdU before fixation. (E) Cell were counted in control, p16Ink4a-OE, p19Arf-OE mESCs 48h after plating (n = 3). All pooled data are represented as means ± SD. The asterisks indicate statistical significance by two-tailed Student’s t-test analysis (n.s. not significant; * p<0.05; ** p<0.01; ***p<0.001).

