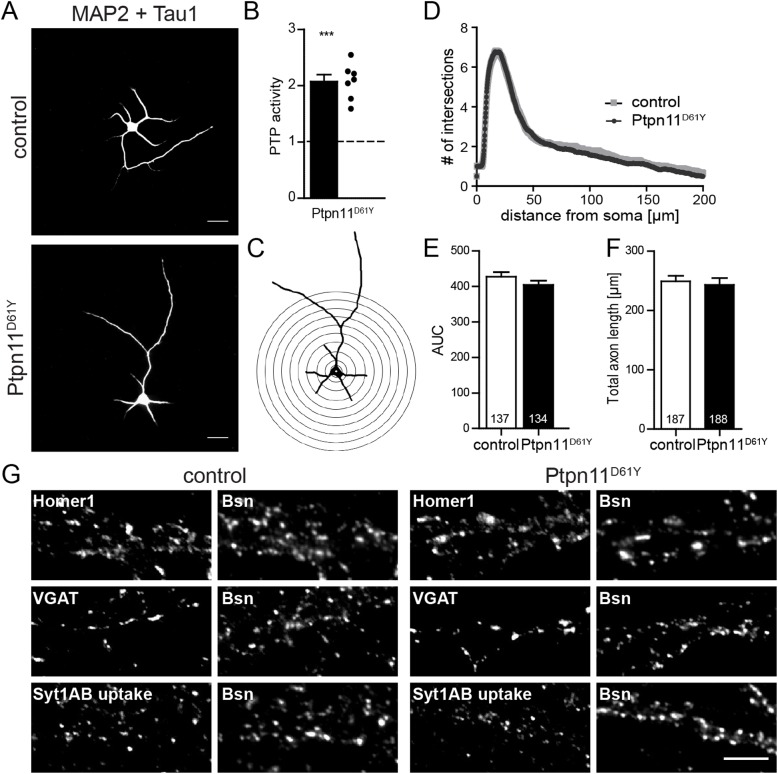
Fig 3. Morphometric analysis of Ptpn11D61Y neurons.
(A) DIV5 neurons were stained with antibodies against the dendritic marker MAP2 and the axonal marker Tau1 for the assessment of dendritic arborization and axonal outgrowth. Scale bar: 50 μm. (B) The Ptpn11-specific PTP activity showed a 2-fold increase in cultured cortical Ptpn11D61Y neurons compared to controls. The points indicate the values from cultures derived from individual animals. (C) Example image of a neuron from (A) after binarization and placement of the array of concentric circles used for Sholl analysis. (D) Sholl analysis of DIV5 neurons is shown, where the number of ramifications is plotted against the distance from the soma. (E, F) The area under the curve (AUC) in Sholl analysis (E) and the axonal length (F) do not differ between control and Ptpn11D61Y neurons. (G) Immunostaining of excitatory (positive for Homer1), inhibitory (positive for VGAT) and active (showing the syt1AB uptake) synapses in DIV14 neurons from control and Ptpn11D61Y. Scale bar: 5 μm. Data are presented as mean ± SEM and analyzed using unpaired t-test. The numbers in columns indicate the number of cells analyzed.

