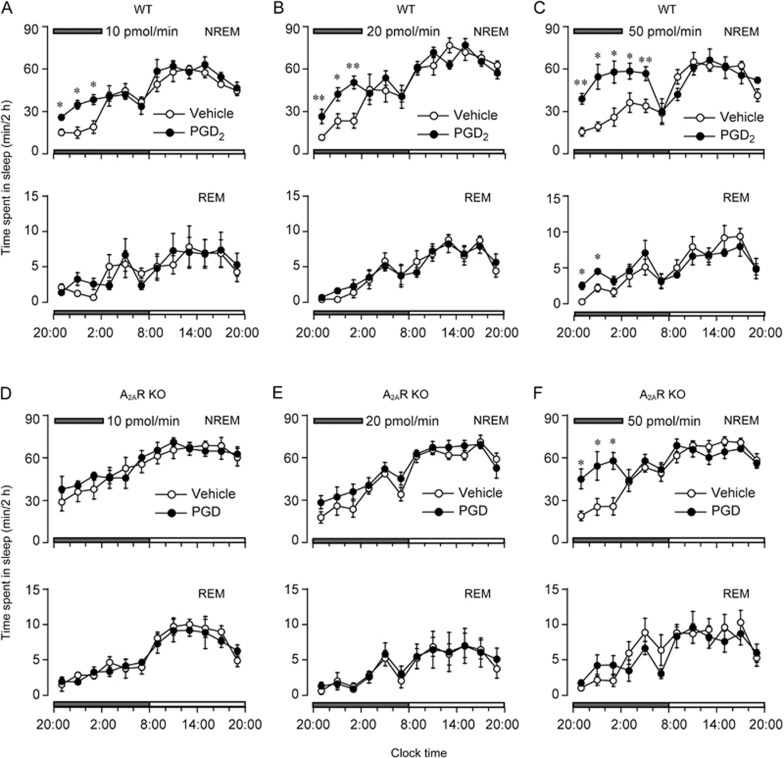
Figure 1.
Sleep-stage distribution produced by PGD2 (10, 20, and 50 pmol/min) infusion into the lateral ventricle in WT mice (A–C) and A2AR KO mice (D– F) between 20:00 and 2:00 indicated by horizontal shaded bars on the experimental day. Each circle represents 2-h amounts of NREM and REM sleep. Open and closed circles signify the vehicle control and PGD2 treatment, respectively. Values are expressed as the mean±SEM (n=5–7). Time course changes in hourly amounts of each stage between vehicle and PGD2 infusion were compared with repeated measures ANOVA followed by Tukey's test and paired t-test. *P<0.05, **P<0.01.

