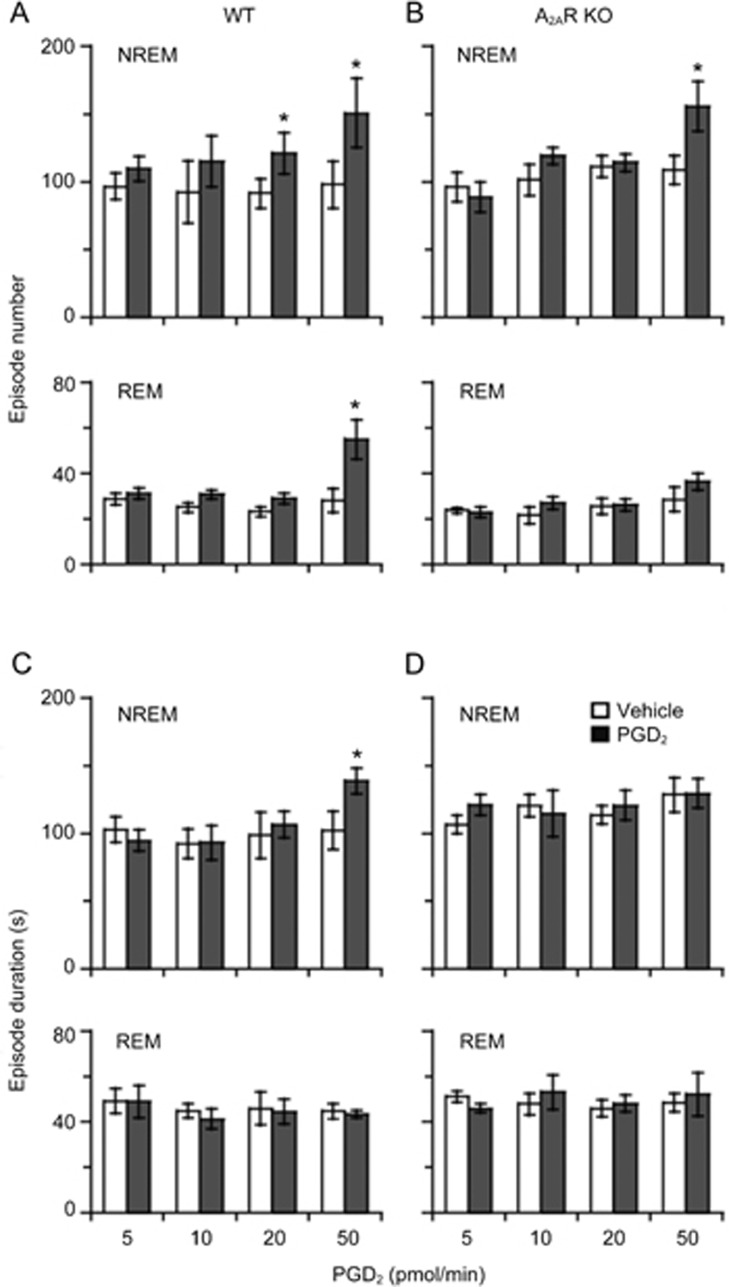
Figure 4.
Episode number (A, B) and episode duration (C, D) for 10 h during PGD2 5, 10, 20, and 50 pmol/min infusion for 6 h and the 4-h period post-dosing in WT and A2AR KO mice. Open and shaded columns show the vehicle control and PGD2 treatment, respectively. Values are expressed as the mean±SEM. n=5–7. *P<0.05 by paired t-test between vehicle and PGD2 infusion.

