Figure 3.
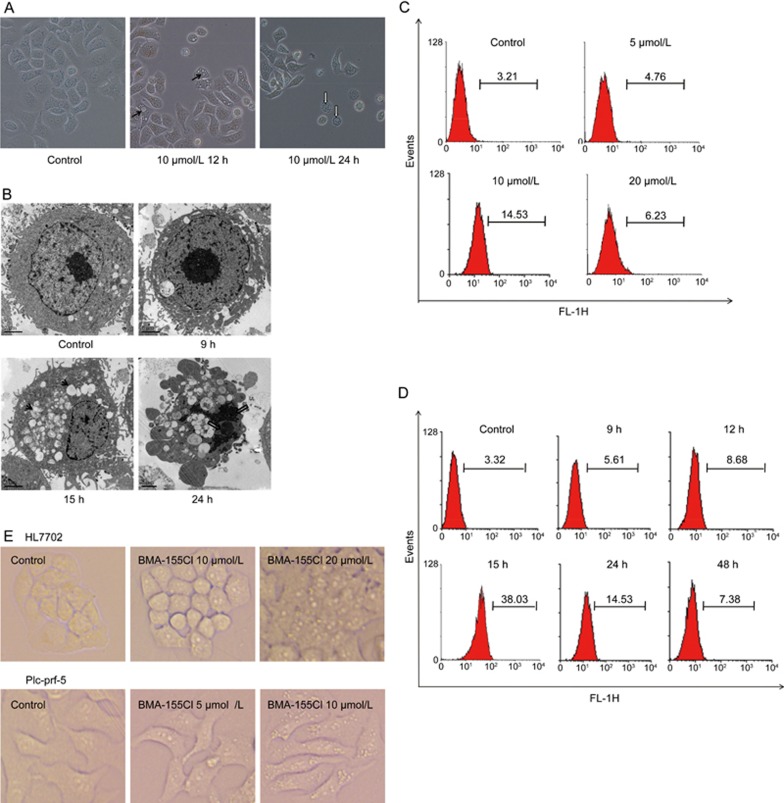
Induction of autophagy by BMA-155Cl in HepG-2 cells. The morphological changes of HepG-2 cells treated with 10 μmol/L BMA-155Cl were observed using phased-contrast microscopy (A) and transmission electron microscope (B, the bar was 2 μm). Autophagic vacuoles were shown as the black arrows at 12 h and 15 h, whereas the apoptosis characterized by nuclear condensation and segregation were shown as the white arrows showed at 24 h. MDC quantitative analysis of HepG-2 cells treated with 0–20 μmol/L BMA-155Cl for 24 h (C) and with 10 μmol/L BMA-155Cl for appointed time (D). (E) The cells (HL7702 and Plc-prf-5) morphological changes were observed using phased-contrast microscopy after being treated with BMA-155Cl for 24 h. Magnification ×40.

