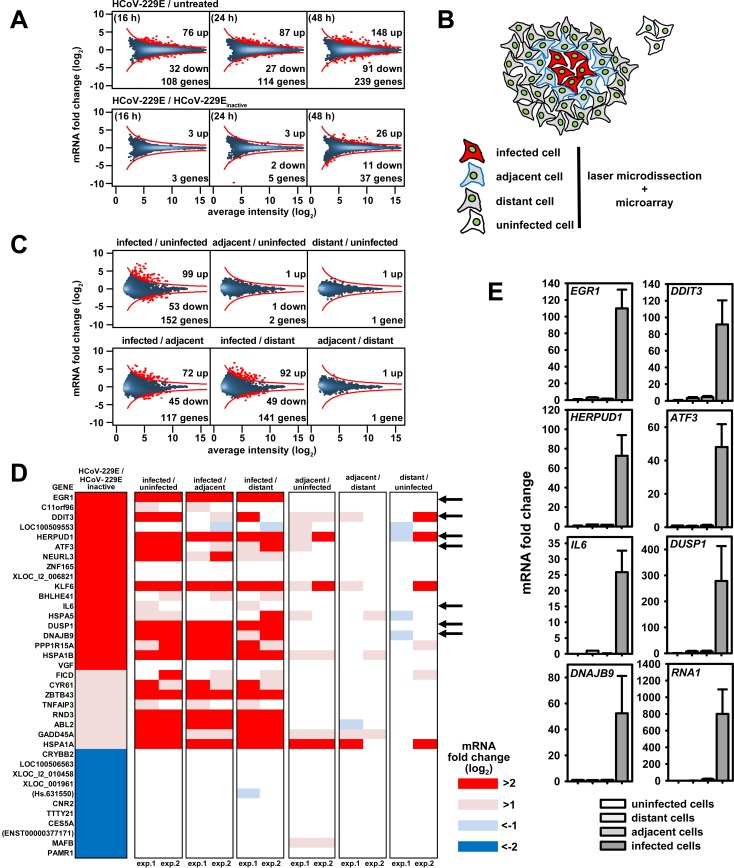
Fig 1. Identification of host cell genes directly regulated in response to HCoV-229E replication in human lung epithelial cells.
(A) A549 lung epithelial cells were infected with HCoV-229E and collected for further analyses at 16, 24 and 48 h p.i.. As controls, cells were mock infected or incubated with heat-inactivated virus and collected at the time points indicated above. Transcriptomes for the respective cells were determined using Agilent microarrays. Graphs represent MA plot visualizations of changes in gene expression (M, log2 ratios) versus mRNA abundance (A, log2 average fluorescence intensity). An intensity-based cut off was calculated and red dots above or below the red lines represent genes with differential expression in response to virus. (B) Scheme of cell populations isolated from HCoV-229E-infected A549 cells at 48 h p.i. or from uninfected cells by laser microdissection. (C) Two independent series of microarray experiments were performed from laser microdissected cells and data were averaged. MA plots showing transcriptome changes in cells infected with HCoV-229E compared to adjacent or distant cells or to noninfected cells collected from a separate mock-infected culture. D) The 37 genes that were specifically regulated by HCoV-229E as shown in (A), lower right panel, were selected and their expression in both independent experiments of laser microdissected cell populations as determined in (C) was visualized by heatmaps. Arrows indicate seven genes with differential expression levels that were further validated by RT-qPCR as shown in (E). Bar graphs displayed in (E) represent mean changes +/- s.e.m. from 3 independent experiments. RNA1 represents the HCoV-229E genome RNA as determined using replicase gene (nsp8)-specific primers. See also S1 and S2 Figs and S1 and S2 Tables.

