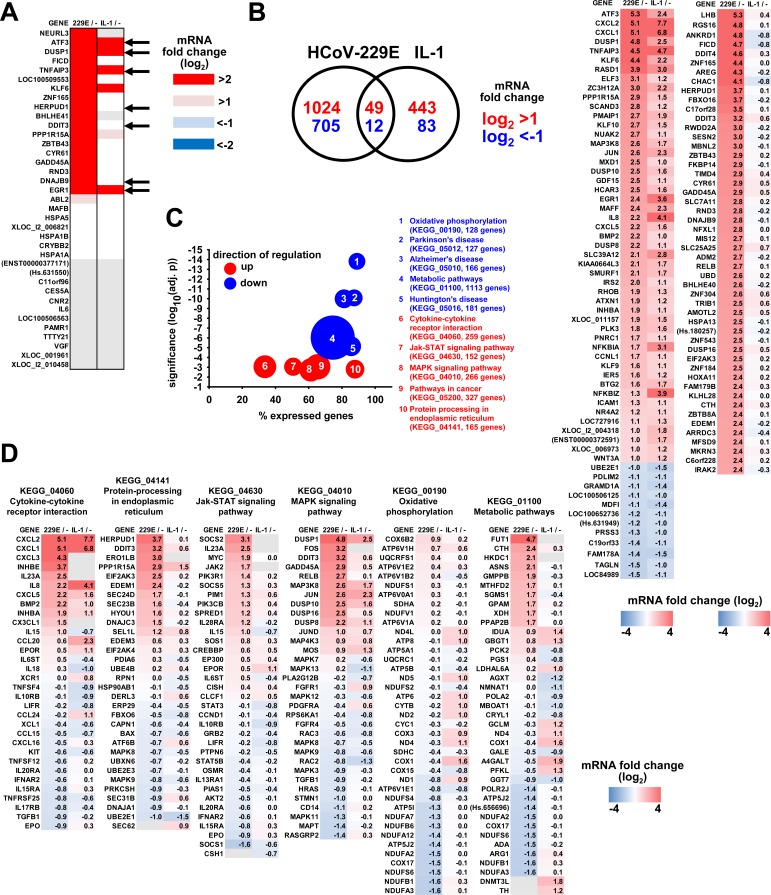
Fig 2. Comparison of HCoV-229E- and IL-1-regulated transcriptomes reveals common and coronavirus-specific sets of genes belonging to specific biological pathways.
HuH7 cells were infected with HCoV-229E for 24 h or were left uninfected. In parallel, cell cultures were treated with IL-1 for 1 h. Transcriptome analyses were performed from total RNA using Agilent microarrays. Data from four independent experiments were pooled of which the last two included IL-1 stimulation. (A) Shown is the overlap of HCoV-229E-regulated genes in HuH7 cells with the 37 genes regulated in A549 cells as identified in Fig 1. Black arrows indicate seven genes whose expression changes were validated by RT-qPCR as shown in S3A Fig. (B) Venn diagram of all genes regulated more than 2-fold that were significantly expressed over background in response to HCoV-229E or IL-1. The left heatmap shows the averaged ratios of the 61 genes that were regulated by both HCoV-229E and IL-1. The right heatmap shows the top 50 genes that were regulated by HCoV-229E only. Individual gene expression ratios for the CoV-specific regulated genes are shown in S3B Fig. (C) Gene set enrichment analyses were used to identify HCoV-229E-regulated KEGG pathways from the four independent experiments. Shown are the ten most strongly down- (blue colors) or upregulated (red colors) pathways as indicated by the adjusted p values. Sizes of bubbles correspond to the total number of genes annotated to each KEGG pathway which varied from 127 genes (KEGG_05012) up to 1113 genes (KEGG_01100). The x-axis indicates the relative number of genes of each pathway that were found to be expressed in HuH7 cells. D) Relative expression data for the top ten up- and downregulated genes of the indicated pathways in response to virus infection or IL-1 treatment were selected. Gene lists were merged and heatmaps show ratios of expression and provide a comparison of virus-infected cells with IL-1 treated cells. Gray colors in (A) and (D) show genes with no detectable expression in a particular condition. See also S3 and S4 Figs and S3 Table.

