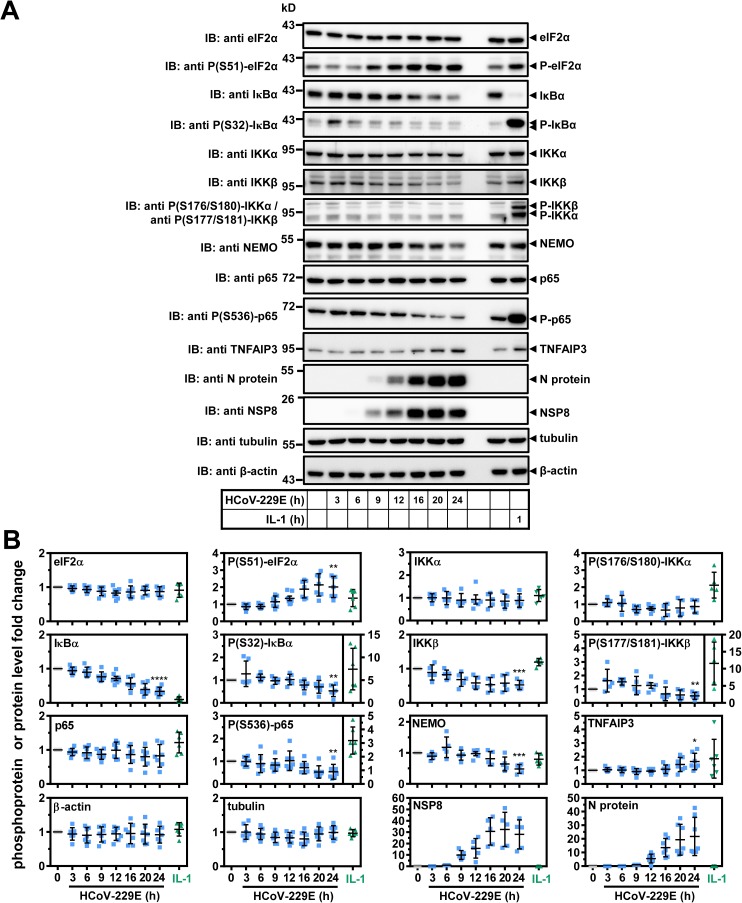
Fig 4. Differential activation or repression of regulators of NF-κB signaling by HCoV-229E or IL-1.
(A) HuH7 cells were infected with HCoV-229E for the indicated times, or were treated with IL-1 for 1 h or were left untreated. Expression and phosphorylation (P) of the indicated proteins was analyzed by immunoblotting of whole cell extracts. Tubulin or β-actin antibodies were used to control for equal loading. (B) Graphs show quantification of relative protein/P-protein levels including means +/- s.d. from five to seven independent experiments. For viral proteins the 6 h (nsp8) or 9 h (N protein) protein levels were set as one. Asterisks indicate significance of differences as obtained from one-tailed t-tests comparing cells infected for 24 h with untreated cells (**** p<0.0001, *** p<0.001, ** p<0.005, * p<0.05). See also S5 Fig.

