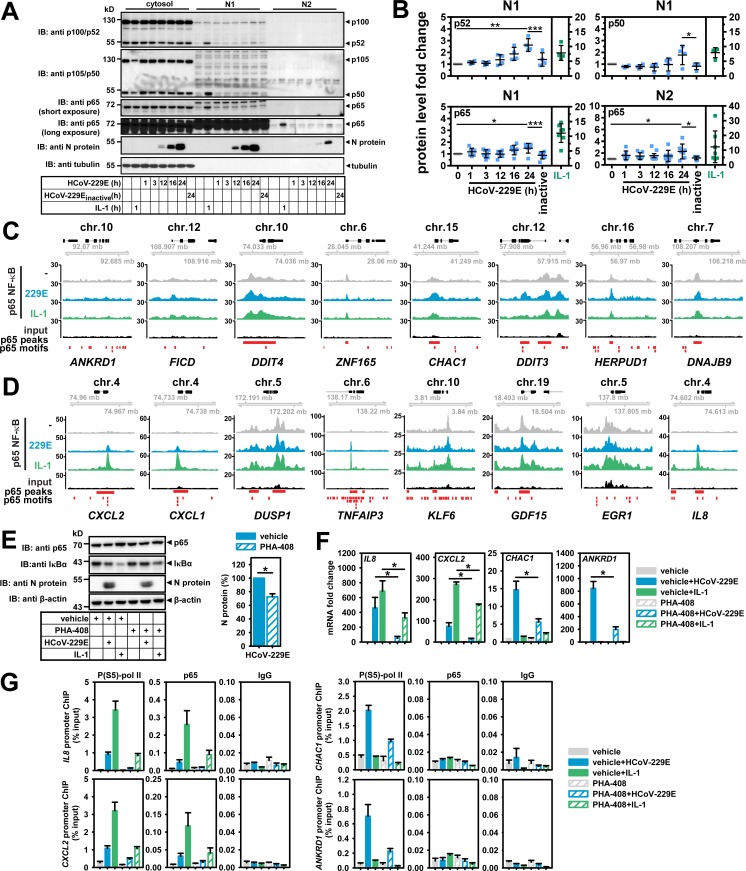
Fig 5. Chromatin recruitment of NF-κB subunits to promoters of IL-1 or HCoV-229E-regulated target genes.
(A) HuH7 cells were infected with HCoV-229E or heat-inactivated HCoV-229E (inactive) for the indicated times, or were treated with IL-1 for 1 h or were left untreated. Then, cytosolic, soluble nuclear (N1) and insoluble nuclear chromatin (N2) fractions were prepared and equal amounts of proteins were analyzed for the expression and translocation of NF-κB subunits and viral nucleocapsid (N) protein. (B) Graphs show quantification of relative protein levels including means +/- s.d. from four independent experiments. p65 levels from three experiments were determined by two different antibodies resulting in a total of seven measurements. Asterisks indicate significance of differences as obtained from one-tailed t-tests comparing cells infected for 24 h with untreated cells, or intact virus versus heat-inactivated virus, respectively (*** p<0.0005, ** p<0.005, * p<0.05). (C, D) Cross-linked chromatin of uninfected, IL-1-treated or HCoV-229E-infected cells was prepared followed by p65 immunoprecipitation and deep sequencing of p65-bound DNA fragments. Depicted are p65 ChIP-seq browser profiles for eight genes whose mRNA levels are specifically regulated by HCoV-229E (C) and for eight genes whose mRNA levels are regulated by both HCoV-229E and IL-1 (D) as shown in Fig 2B. (E) HuH7 cells were treated with solvent (DMSO, vehicle) or with the IKKβ inhibitor PHA-408 (5 μM) for 30 min followed by infection with HCoV-229E for 24 h or treatment with IL-1 for 1 h. Equal amounts of proteins from whole cell extracts were analyzed for the expression of p65 NF-κB, IκBα and viral N protein. β-actin antibodies were used to control for equal loading. Right graph: Quantification of relative N protein levels (mean +/- s.e.m.) from four independent experiments. (F) Mean relative changes +/- s.e.m. of mRNA expression of HCoV-229E or IL-1 target genes from four independent experiments of cells treated as in (E). (G) Recruitment of phosphorylated RNA pol II and p65 to the promoters of these target genes. Shown are results (mean +/- s.e.m.) from two independent ChIP-PCR experiments, IgG precipitations served as negative controls. The asterisks indicate significance of differences as obtained from t-tests (* p<0.01). See also S5 and S6 Figs.

