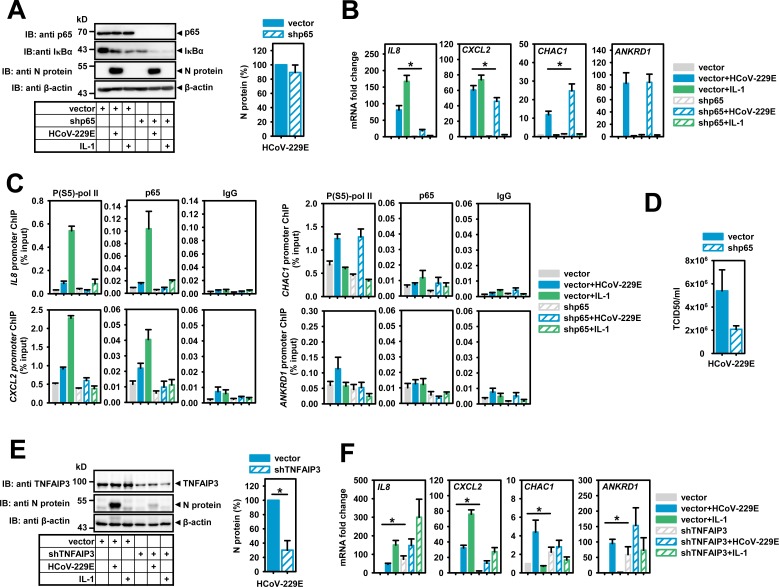
Fig 6. Suppression of p65 NF-κB or TNFAIP3 (A20) affect HCoV-229E replication and transcriptional regulation of NF-κB target genes.
HeLa cells were transiently transfected with empty pSuper (vector), pSuper encoding shRNAs directed against p65 (B-D) or pLKO.1 encoding shRNAs against TNFAIP3 (E, F). One day later, cells were selected for 48 h (shp65) or 72 h (shTNFAIP3) in 1 μg/ml puromycin. Then, cells were infected with HCoV-229E for 24 h or were treated with IL-1 for 1 h. (A) Equal amounts of proteins from whole cell extracts were analyzed for the expression of p65 NF-κB, IκBα and viral N protein. β-actin antibodies were used to control for equal loading. Right graph: Quantification of relative N protein levels (mean +/- s.e.m.) from six independent experiments. (B) Mean relative changes +/- s.e.m. of mRNA expression of HCoV-229E or IL-1 target genes from six independent experiments of cells treated as in (A). (C) Recruitment of phosphorylated RNA pol II or p65 to the promoters of these target genes. Shown are results from two independent ChIP-PCR experiments, IgG precipitations served as negative controls. (D) Viral titers (mean TCID50/ml +/- s.e.m.) were determined in the supernatants of the same cells used for the experiments described in (C). (E) Equal amounts of proteins from whole cell extracts were analyzed for the expression of TNFAIP3 and viral N protein. β-actin antibodies were used to control for equal loading. Right graph: Quantification of relative N protein levels (mean +/- s.e.m.) from five independent experiments. (F) Mean relative changes +/- s.e.m. of mRNA expression of HCoV-229E or IL-1 target genes from five independent experiments. The asterisks indicate significance of differences as obtained from t-tests (* p<0.05). See also S6 Fig.

