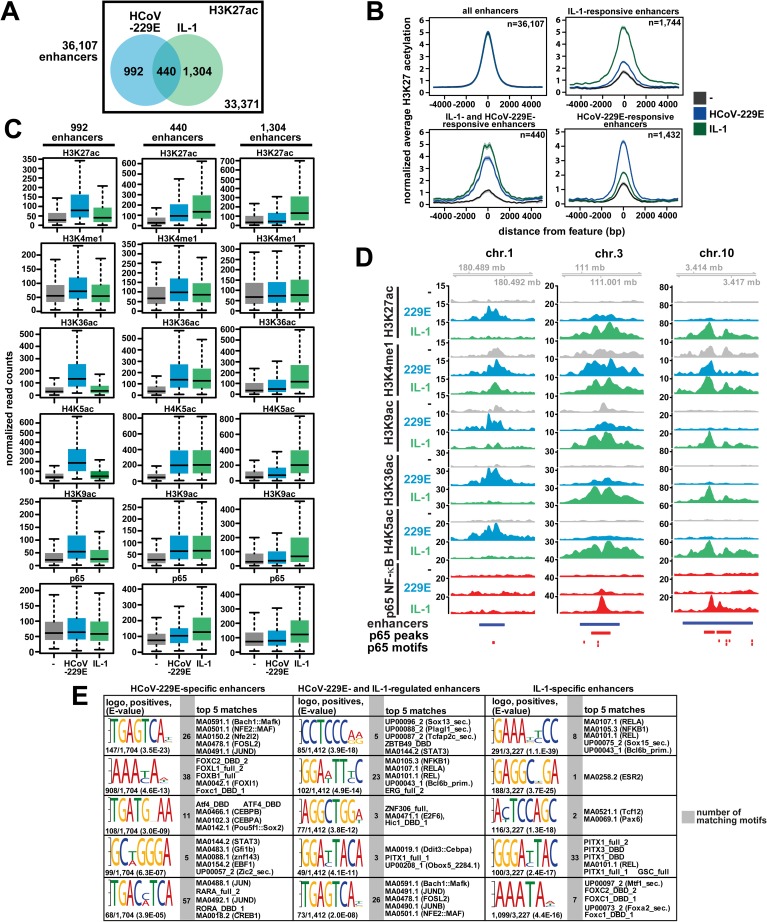
Fig 8. Identification and genome wide distribution of HCoV-229E-regulated enhancers.
(A) Total number of active enhancers based on the presence of H3K27ac and H3K4me1. The Venn diagrams show numbers of regulated enhancers based on 2-fold change in H3K27ac in response to HCoV-229E, IL-1, or both. (B) Centered meta-profiles of H3K27ac across genomic enhancer regions as defined in (A). (C) Quantification of histone modifications and p65 binding for 992 HCoV-229E-specific and 1,304 IL-1-specific groups of enhancer regions as well as 440 groups of enhancer regions regulated by both stimuli. (D) Shown are browser profiles for enhancers representing HCoV-229E-specific (chr.1), IL-1-specific (chr.10) and jointly regulated (chr.3) enhancers. The blue bars mark the enhancer regions. Red bars mark p65 binding events and red vertical bars mark predicted p65-binding motifs. (E) Enhancer valleys defined as the intervening DNA regions between two H3K27ac peaks of all regulated enhancers as identified in Fig 8A were extracted revealing 1,704 regions specific for HCoV-229E, 1,412 regions regulated by both HCoV-229E and IL-1 and 3,227 regions regulated specifically by IL-1. These enhancer elements were then analyzed by DREME for the enrichment of DNA motifs followed by the analysis of matches to known TF binding sites by TomTom. Shown are the logos for the top five DREME-enriched motifs, the number of motifs per total number of identified enhancer valleys (positives) and the enrichment p value (E value) of the DREME analysis. The gray columns show the total numbers of matching motifs and the right columns show the top five TF-binding site motifs found by TomTom. See also S7 Fig. Statistics for box plots of (C) are shown in S4 Table. See also S7–S9 Figs.

