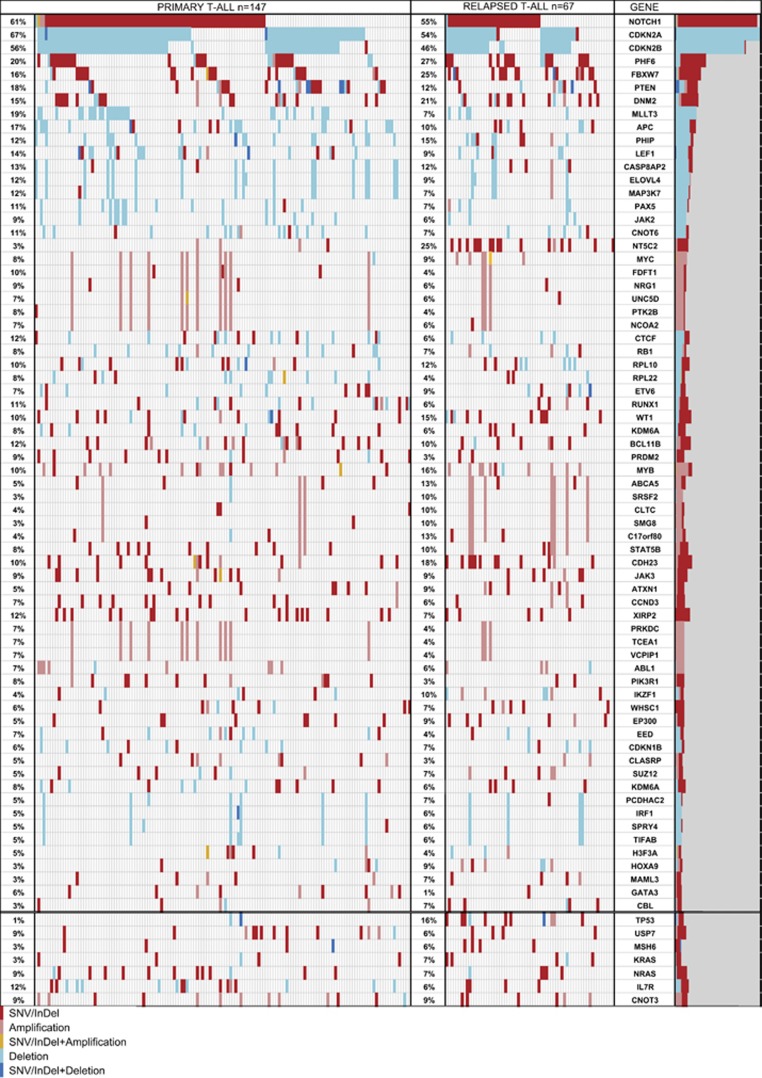
Figure 3.
Comparison of the pattern of alterations in initial diagnosis patients (n=147) and in relapse (n=67) in the genes with high mutation density of SNVs/InDels (>1.9/Mbp; Supplementary Table 7) or/and high frequency of CNA (>5% of patients; data available for 202 patients: 59 REL and 144 INI). Frequencies refer to all mutations (SNVs/InDels+CNAs), alterations were sorted according to their frequency and position in the genome. Red—SNV/InDel; pink—amplification; orange—SNV/InDel+amplification; pale blue—deletion; dark blue—SNV/InDel+deletion.

