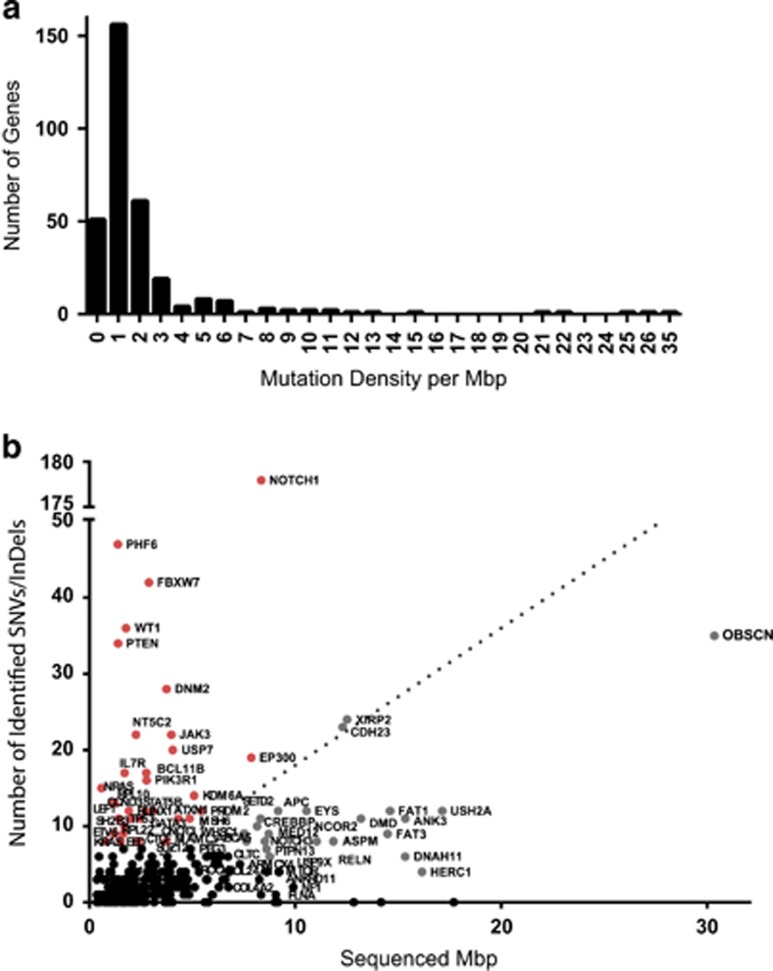
Figure 4.
(a) Histogram of the distribution of mutation density in the analyzed genes (b) Mutation density shown as length of the targeted exons (Mpb) plotted against the absolute number of detected SNVs/InDels; red—known leukemia drivers or cancer-related genes; gray—genes that show low mutation density (<2), regardless of the high mutation frequency observed in some of them (for example, OBSCN, XIRP2, CDH23); black—genes that carry a low absolute number of mutations (n<10).

