Figure 7.
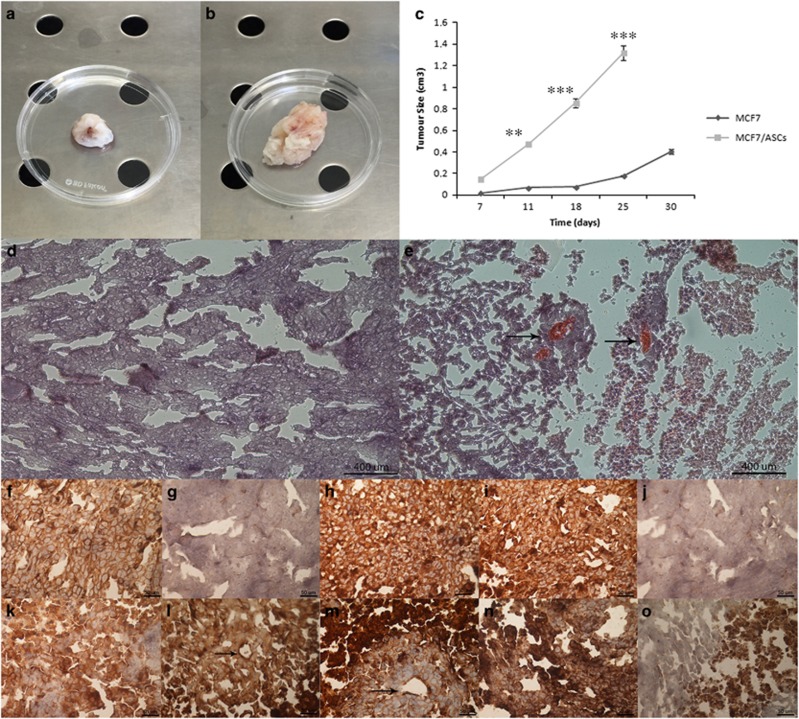
Xenograft evaluation. (a, b) Xenografted tumour derived from implantation of MCF7 alone and MCF7 with hASCs. (c) Xenografted tumour growth curves show that the injection of MCF7 with hASCs form tumours with major efficiency in comparison with injection of MCF7 alone. (d, e) H&E staining of xenografted tumour derived from implantation of MCF7 alone and MCF7 with hASCs. Scale bar=400 μm. (f-j) Positivity for I Class HLA, negativity for CD31, positivity for VEGF and cytokeratin, negativity for vimentin on xenografted tumour derived from implantation of MCF7 alone. (k-o) Positivity for I Class HLA, CD31, VEGF, cytokeratin and vimentin on xenografted tumour sample derived from implantation of MCF7 with hASCs. Arrows indicate blood vessels. Scale bar=50 μm. **P<0.001, ***P<0.0005 compared to the parental cell line. Results are represented as mean±S.E.M. of three independent experiments

