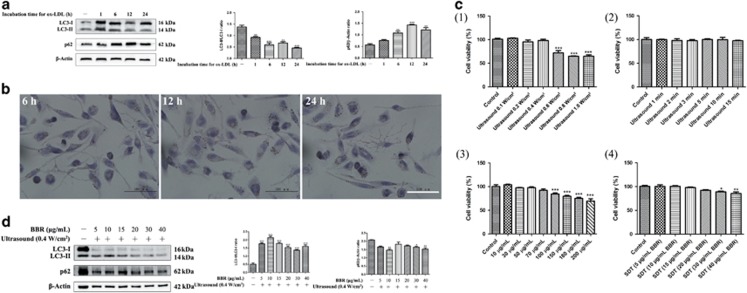
Figure 5.
BBR-SDT similarly induced autophagy in autophagy-resistant foam cells induced by ox-LDL. (a) THP-1 macrophages were incubated with ox-LDL for various periods of time as indicated. Levels of LC3-I, LC3-II, and p62 were then analyzed by western blotting and the data are quantified in the two panels to the right (n=3; **P<0.01 and ***P<0.001 versus control). (b) Representative images of THP-1 macrophage morphology following incubation with ox-LDL for 6, 12, and 24 h are shown. Oil Red O staining was performed to examine foam cell formation. (c) Cell viability was assayed in CCK-8 assays for foam cells that were treated with: (1) different ultrasound intensities, (2) varying durations of exposure to ultrasound (0.4 W/cm2), (3) different concentrations of berberine, and (4) different concentrations of BBR-SDT (0.4 W/cm2) (*P<0.05, **P<0.01, and ***P<0.001 versus control). (d) Levels of LC3-I, LC3-II, and p62 in foam cells post-BBR-SDT were analyzed by western blotting. Quantitation of the LC3-II/LC3-I ratios are presented to the right as the mean±S.D. (n=3; *P<0.05, **P<0.01, and ***P<0.001 versus control)

