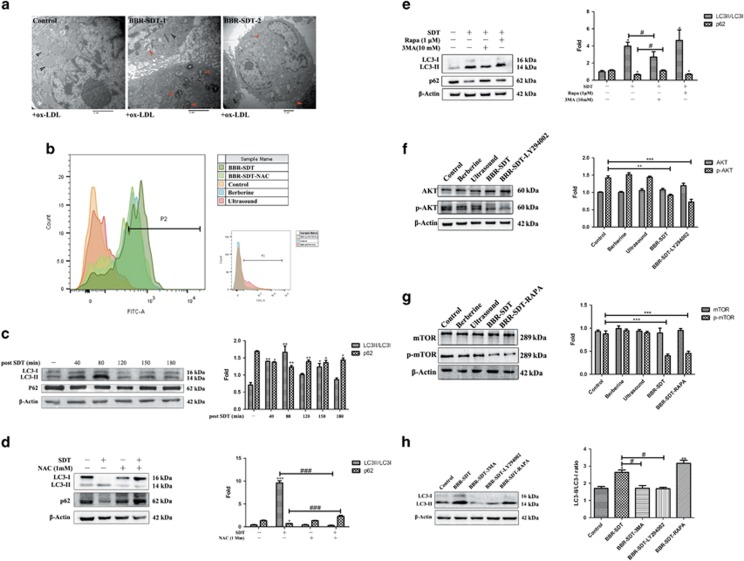
Figure 6.
Time-dependent induction of autophagy and suppressed PI3K/AKT/mTOR signaling in foam cells treated with BBR-SDT. (a) Ultrastructural changes in foam cells treated with ox-LDL were observed by TEM at 1 and 2 h post-BBR-SDT. Black arrows indicate lipid droplets, red arrows indicate autophagosomes. Scale bar, 2 μm.(b) The relative fluorescence intensity for ROS generation detected in foam cells with or without pretreatment with the ROS scavenger, NAC (1 mM), as determined by flow cytometry following DCFH-DA staining (n=3; berberine autofluorescence). Western blot analysis and quantification of fold change in LC3-II/LC3-I ratios and p62 levels in foam cells: (c) post-BBR-SDT at different time points (*P<0.05 and **P<0.01 versus control), (d) with and without pretreatment with NAC and post-BBR-SDT (*P<0.05 and ***P<0.001 versus control; ###P<0.001 versus BBR-SDT groups), and (e) with and without rapamycin (Rapa) and 3MA pretreatment and post-BBR-SDT (*P<0.05 versus control, #P<0.05 versus BBR-SDT groups). In addition, western blots were analyzed post-BBR-SDT for: (f) levels of total Akt and p-Akt following LY294002 pretreatment, (g) levels of total mTOR and p-mTOR following rapamycin (RAPA) pretreatment, and (h) levels of LC3-I, LC3-II, and β-actin following pretreatment with LY294002, 3MA, or rapamycin (RAPA). The corresponding quantifications of fold change and ratios are presented as the mean±S.D. (*P<0.05, **P<0.01, and ***P<0.001 versus control, #P<0.05 versus BBR-SDT groups)

