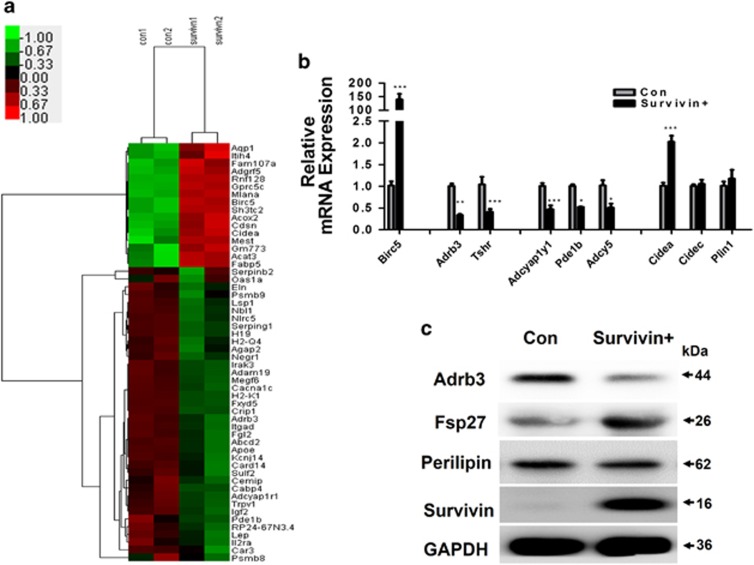
Figure 3.
RNA sequencing analysis of Survivin's potential function in adipocytes. RNA sequencing and data analysis of the control and Survivin overexpression group. cDNA libraries were constructed from total RNAs extracted and analyzed sequences on the Illumina HiSeqTM 2500. (a) Heatmap analysis displayed the DEGs between the control and Survivin overexpression group. A red–green color scale was used to reflect standardized gene expression, with red representing a high expression and green representing a low expression (scale shown in the upper left). Cutoff values were FDR<0.05 and a fold change ratio>1.5 change. Results of RNA sequencing were tested in 3T3-L1 adipocytes (b and c). Lipolysis-associated protein, cAMP metabolism related genes and lipid droplet envelope protein were tested by qRT-PCR (b). (c) Protein levels of Adrb3, Fsp27 (Cidec), Perilipin, Survivin and GAPDH were determined by western blot. *P<0.05, **P<0.01, ***P<0.001

