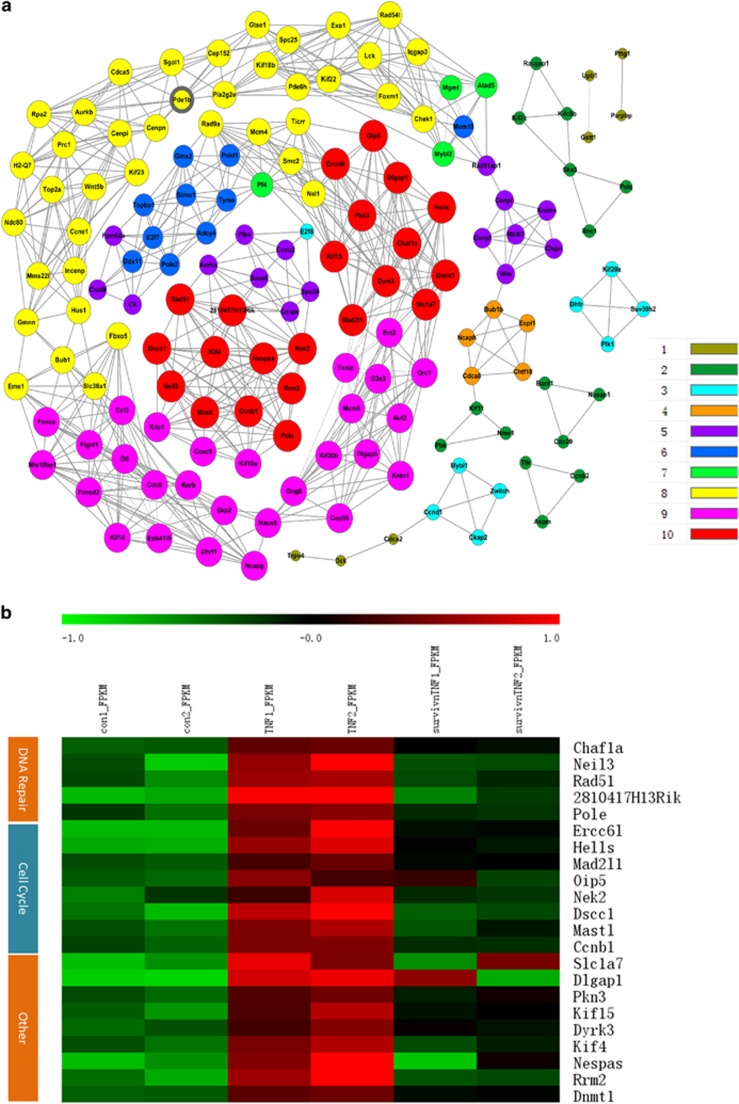
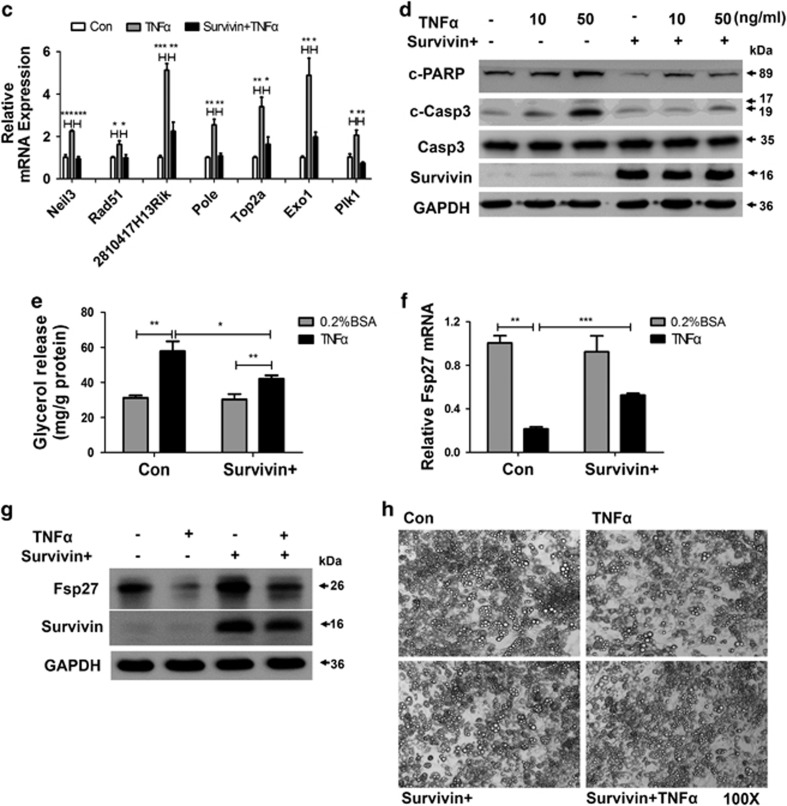
Figure 5.
Survivin partly rescues TNFα-induced changes in gene expression involved in DNA repair pathways and related PARP activation, as well as lipolysis. The mRNA expression differences were detected by RNA sequencing analysis, and series cluster analysis was introduced to discover the expression trend of DEGs from the control, TNFα, and Survivin overexpression+TNFα group. Two strains of series cluster analysis were merged, and DEGs were used to do a deep analysis (a and b). (a) Co-expressed genes and their networks in DEGs. A k-core of a given gene indicates its hub status with connection to ‘k' other genes in a network (scale shown in the lower right). (b) Heatmap of hub genes with the highest k-core (k-core=10) in Co-expression analysis. Red represents a higher level of gene expression, and green represents a lower level gene expression (scale shown in the upper). FDR<0.05 and a fold change ratio>1.5 change were identified as the boundary value. (c) Genes related to DNA repair were evaluated by qRT-PCR. (d) Protein levels of PARP and caspase 3 were detected by western Blot. (e) 3T3-L1 adipocytes were stimulated with 10 ng/ml TNFα for 3 h, then media was removed for glycerol measurement. Fsp27 was tested by qRT-PCR (f) and western blot (g) in 3T3-L1 adipocytes after stimulation with TNFα for 24 h. (h) Cell morphology was observed by light microscopy after 6 days of 10 ng/ml TNFα treatment. Original magnification, × 100. *P<0.05, **P<0.01, ***P<0.001


