Figure 1.
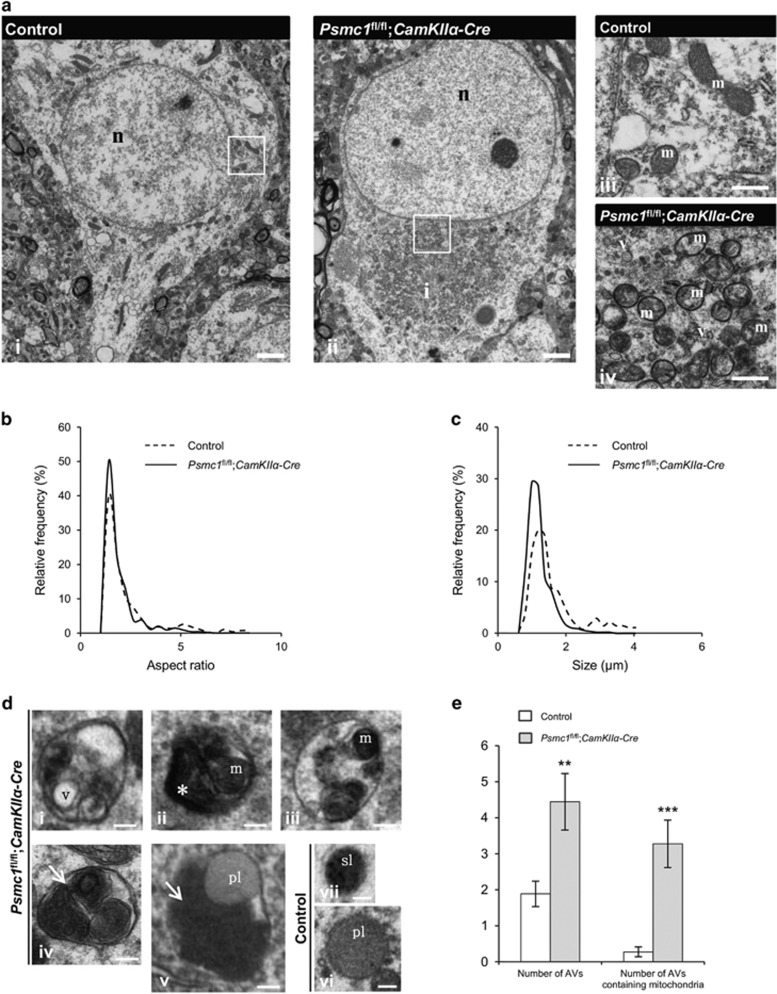
Mitochondrial fragmentation and mitophagy in 26S proteasome-impaired neurons. (a) Representative EMs of control (i) and Psmc1fl/fl;CaMKIIα-Cre (ii) cortical neurons at 6 weeks old. Enlarged views of mitochondria in boxed areas are shown in (iii, control) and (iv, Psmc1fl/fl;CaMKIIα-Cre). n, nucleus; i, inclusion; m, mitochondria; v, vesicle. Scale 2 μm (i and ii) and 500 nm (iii and iv). (b and c) Smoothed line frequency histograms of mitochondrial aspect ratio and size distribution respectively for control and Psmc1fl/fl;CaMKIIα-Cre neurons. P<0.001 (b) and P<0.0001 (c) by Mann–Whitney test. (d) Representative AVs in 6-week-old Psmc1fl/fl;CaMKIIα-Cre cortical neurons (i–v) with heterogeneous intraluminal contents; vesicles (i; v), amorphous material (ii; asterisk) and condensed mitochondria (ii-v; m). Aggregates of condensed mitochondria resembling mitochondria undergoing autophagy are shown (iv and v; arrows). Representative primary (vi; pl) and secondary lysosomes (vii; sl) in 6-week-old control cortical neurons. Scale 200 nm. (e) Quantification of the total number of AVs and AVs containing mitochondria in 6-week-old control and Psmc1fl/fl;CaMKIIα-Cre neurons. Error bars represent S.E.M. **P<0.01 and ***P<0.001 by unpaired Student's t-test. Quantification in Figure 1 used 18 randomly selected neurons from three different control and Psmc1fl/fl;CaMKIIα-Cre brains

