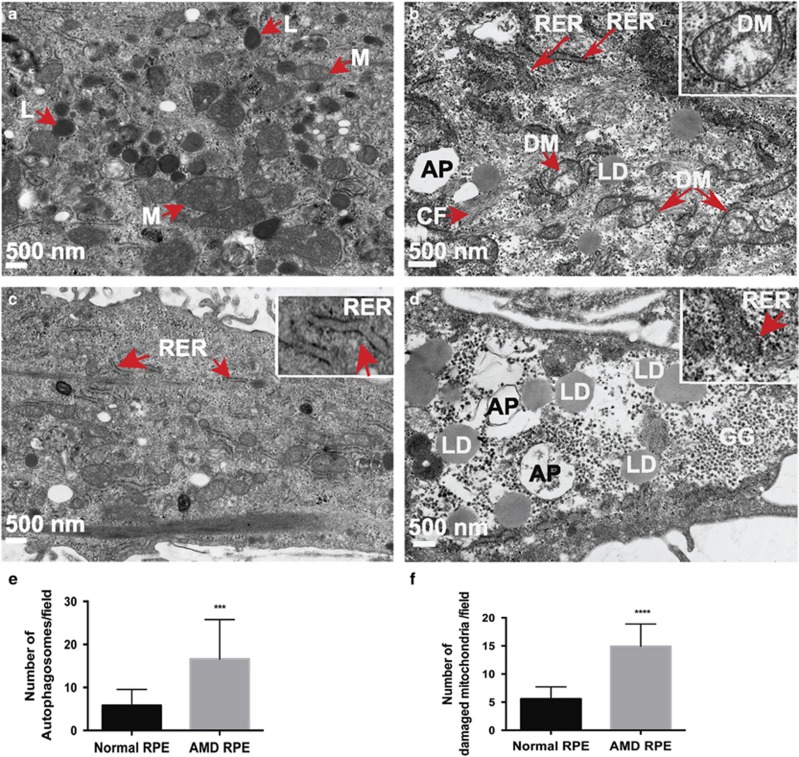
Figure 2.
AMD RPE exhibit disease phenotypes. (a-d) EM images of normal 10 (a and c) and AMD 9 (b and d) RPE showing disease phenotypes. Red arrows indicate the observed morphological differences. Higher magnification insets show the observed phenotypes (in b and d), in comparison with the normal cellular structures (in c). L, lysosomes; M, mitochondria; RER, rough ER; LD, lipid droplets; F, cytoskeletal fascicles. (e and f) Number of APs and damaged mitochondria were counted (n=3) in four random regions per cell. The images used for counting were all the same size and same magnification. The mean±S.D. and the P-values were calculated for statistical significance. P-value equals 0.0002 (***) and 0.0001 (****) for (e and f), respectively

