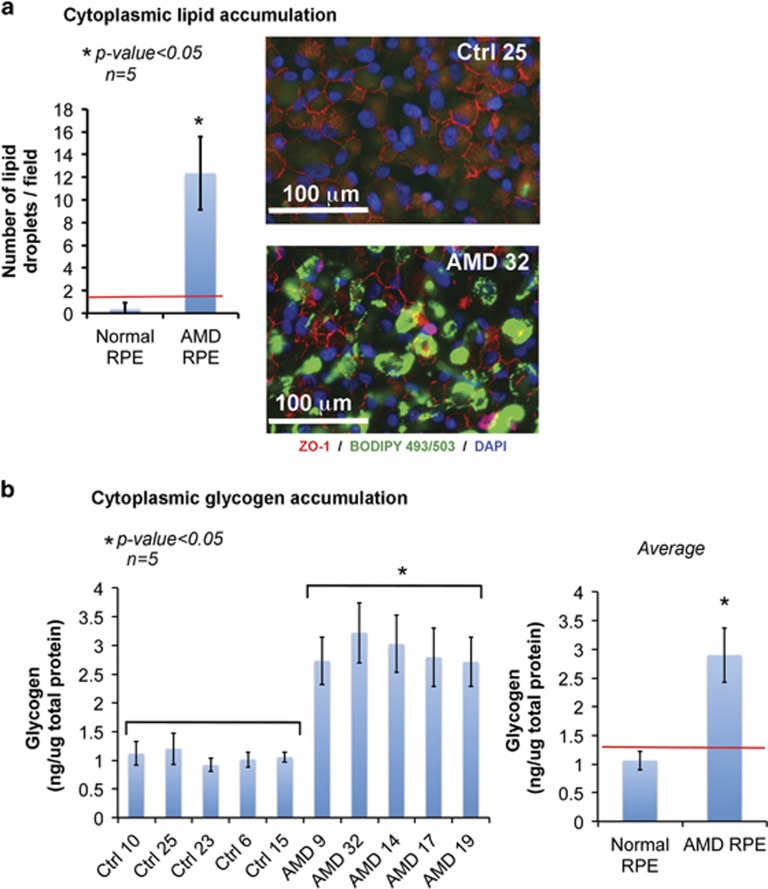
Figure 3.
Lipid and glycogen accumulation in AMD RPE. (a) (Left): graph showing the quantification of lipid droplets in normal and AMD RPE, as determined by counting the lipid droplets in three random fields of stained images (shown in right panel), in the five normal and five AMD RPE (n=5). Asterisk (*) indicates statistically significant difference in number of lipid droplets between control and AMD RPE. (a) (Right): analysis of cytoplasmic lipid by fluorescence staining in control and AMD RPE, showing higher intensity of lipid staining in the AMD RPE. (b) (Left): measurement of glycogen accumulation by colorimetric assay showing statistically significant higher concentration in the AMD RPE compared with control RPE (n=5). (b) (Right): graph of the average glycogen concentrations calculated from five normal and five AMD RPE shown in the left graph. Red line indicates the threshold that separates AMD and normal RPE. Asterisk (*) indicates statistically significant differences in glycogen concentrations between the AMD and control RPE. P-values in (a and b) are determined by ANOVA followed by Tukey's test, with P<0.05

