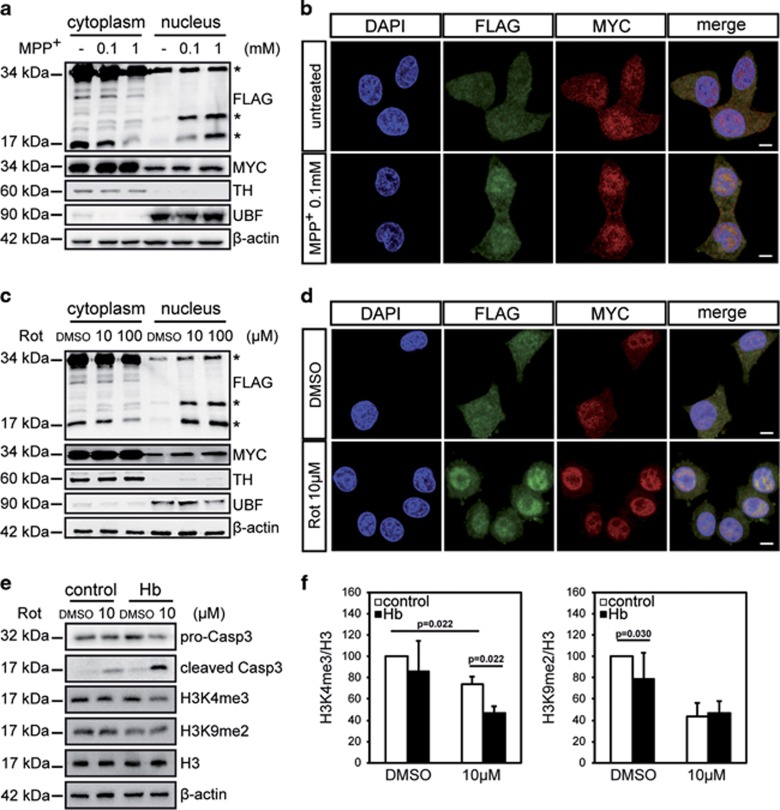
Figure 2.
Neurochemical intoxication increases Hb in the nucleus. Differentiated Hb cells were treated with MPP+ (a and b) or rotenone (c–f) at the indicated concentrations for 16 h. (a and c) Western blotting analysis of cellular fractionation was carried out with anti-FLAG (α-globin) and anti-MYC (β-globin) antibodies. Anti-TH and anti-UBF antibodies were used to visualize specifically cytoplasm and nucleus compartment, respectively. β-Actin was used as a loading control. (n=5, n=4) (b and d) Double immunofluorescence was performed with anti-FLAG (α-globin) and anti-MYC (β-globin) antibodies. Nuclei were marked by DAPI (4,6-diamidino-2-phenylindole). Scale bar 5 μm. (n=3, n=4) (e) Western blotting analysis of H3K4me3 and H3K9me2 expression. For normalization, the total levels of H3 and β-actin were detected. Levels of pro-Caspase-3 (pro-Casp3) and cleaved Caspase-3 (cleaved Casp3) were also monitored. (n=3) (f) Densitometric analysis of H3K4me3 and H3K9me2 expression. H3K4me3 and H3K9me2 levels were normalized to H3 and β-actin. Untreated control cells was used as reference and set to 100%. (n=3, n=3) Values are mean±S.D. Data were evaluated statistically by Student's t-test. The P-values were adjusted for multiple testing using the Benjamini–Hochberg method to control the false discovery rate. Resulting P-values are indicated

