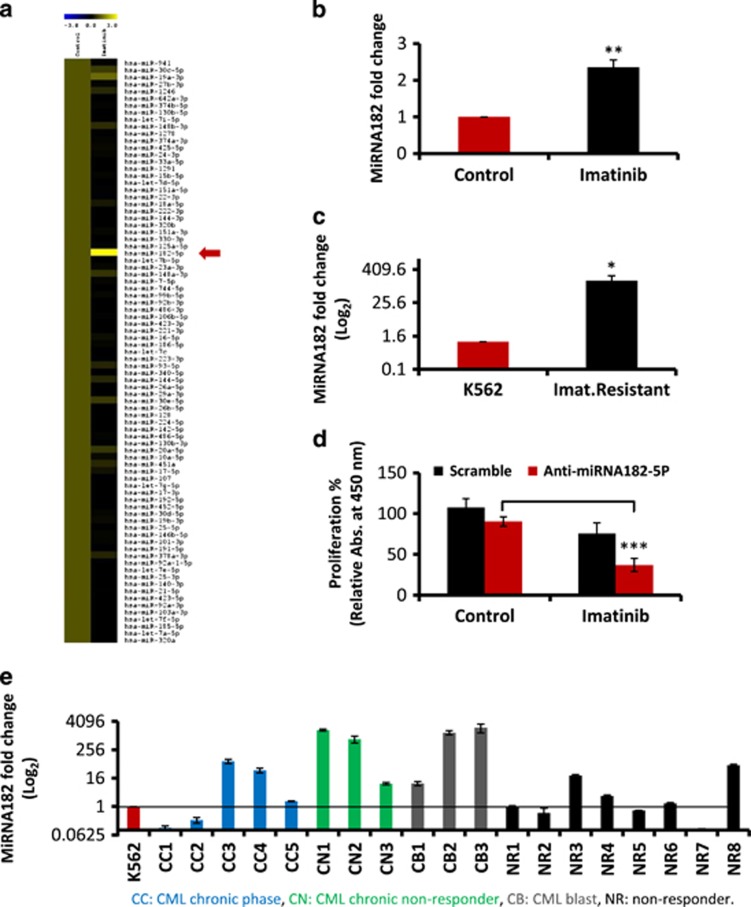
Figure 1.
High expression of MiRNA182-5p is associated with TK inhibitor resistance in CML cells. (a) Heatmap of differentially expressed miRNAs between control and imatinib-treated K562 cells. Column labels represent the type of sample: control and imatinib. The red arrow shows miRNA182-5p expression in the heatmap. Range of expression measured was −3- to +3-fold change. (b and c) Expression of miRNA182-5p in K562 cells after imatinib treatment (b) and imatinib-resistant K562 cells (c). Data are shown as mean of three independent experiments. Error bars show s.e. of three independent experiments with P-values of the mean. **P<0.01 and ***P<0.001. (d) Percentage cell proliferation of LNA anti-miRNA182-5p-transfected K562 cells with TK inhibitor. The data are compared with scramble control. Data are shown as mean of three independent experiments. Error bars show s.e. of three independent experiments with P-values of the mean. *P<0.05, ***P<0.001. (e) Expression of miRNA182-5p in clinical samples of CML. The Y-axis shows the fold change in miRNA182-5p expression (log2 scale). Data are presented as mean of three biological triplicates. The normalisation is undertaken to the expression of miRNA182-5p from K562 cell line. CC, CML chronic phase; CN, CML chronic nonresponder; CB, CML blast; NR, nonresponder

