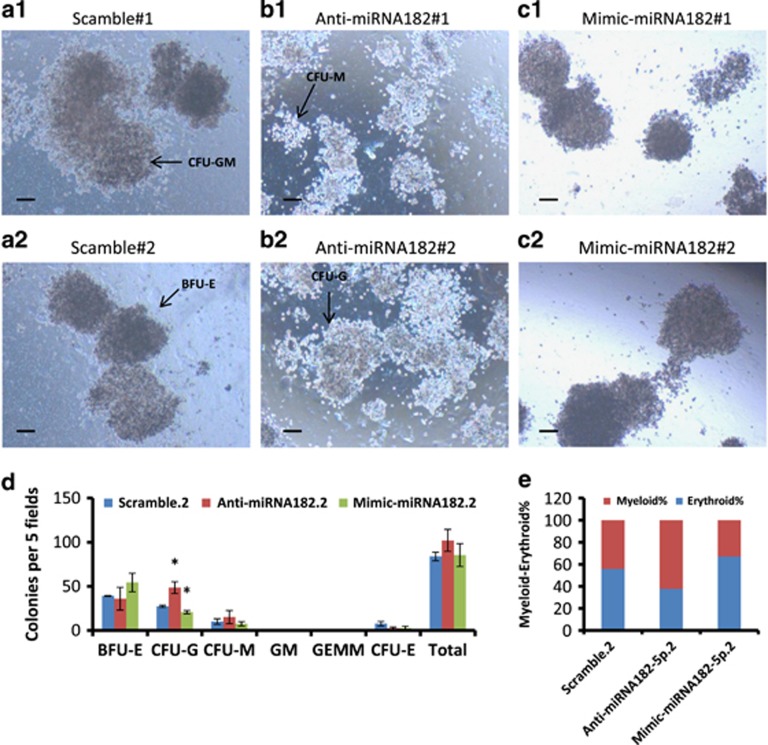
Figure 2.
Modulation in the expression of MiRNA182-5p results in a shift of ME% in K562 cells. (a–c) Representative images of colonies formed in methylcellulose CFU assay with scramble- (a), anti-miRNA182-5p- (b) and miRNA182-5p mimics-transfected K562 cells (c). Images are taken at × 4 magnification. Scale bar represents 100 μm. BFU-E, CFU-M, CFU-G and CFU-GM are shown in a2, b1, b2 and a1, respectively. (d) Quantitation of the colony counts and types on day 21 with each condition. Data are shown as number of colonies per five fields. Error bars show s.e. of three independent experiments with P-values of the mean. *P<0.05, **P<0.01 and ***P<0.001. (e) ME% shows the lineage distribution in colony formation assay

