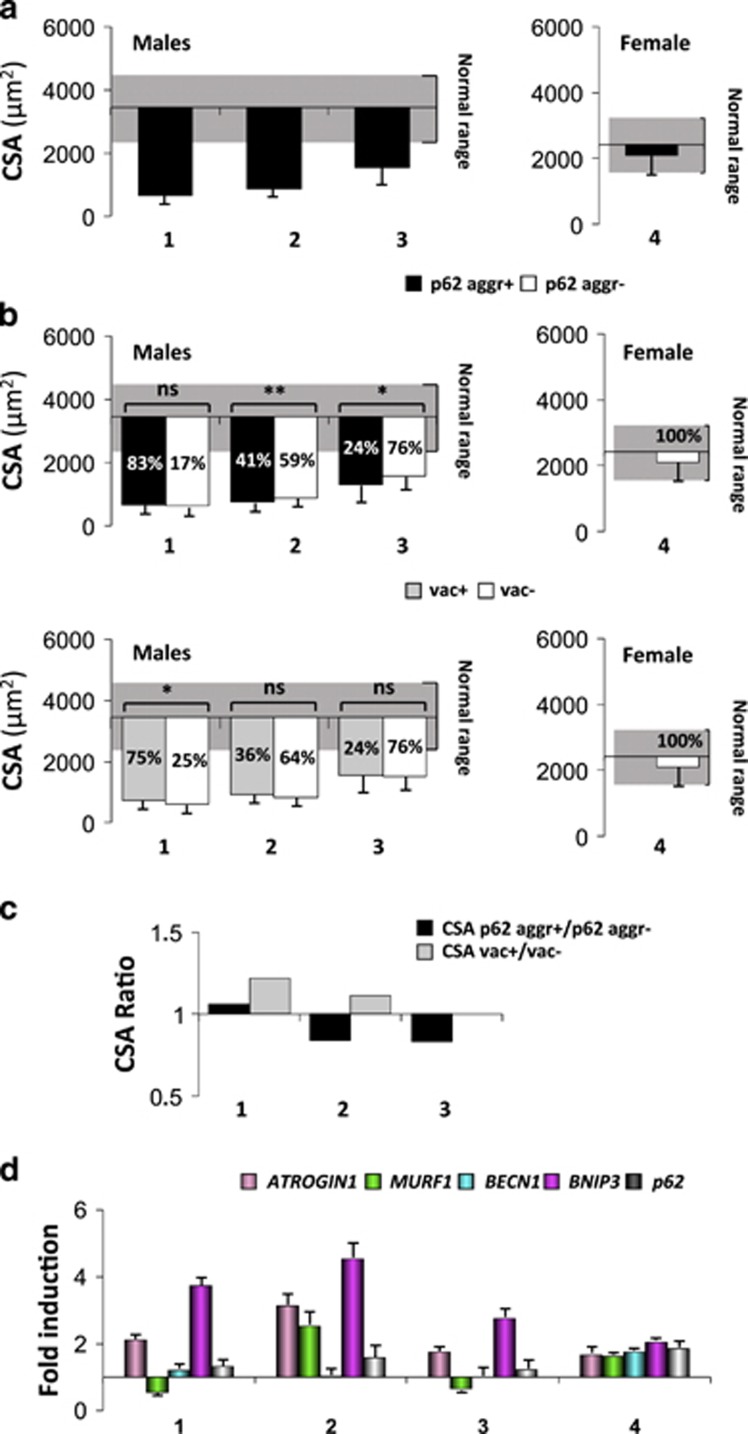
Figure 2.
Characterization of atrophy and autophagy in Danon disease. (a) Mean CSA of total myofibers. (b) CSA of fibers showing p62-positive aggregates (p62+ aggr) compared with fibers without p62-positive aggregates (p62- aggr) and vacuolated (vac+) compared with non-vacuolated (vac-) fibers, relative to healthy age- and sex-matched controls (male controls mean CSA: 3446±950 μm2; female controls mean CSA: 2419±786 μm2; dashed box: normal CSA range). The percentages of p62-positive, negative, vacuolated and non-vacuolated fibers are reported in the bars. **P<0.0001; *P<0.05; NS, not significant. n>200 fibers measured. (c) CSA ratio of p62-positive versus negative and vacuolated versus non-vacuolated fibers. When the size of fibers containing p62 aggregates (or vacuoles) is smaller than that of the negatives, it will result in a ratio below 1. (d) qRT-PCR analysis of the atrophy-related genes and of p62. The fold induction is compared with age-matched controls and normalized to GAPDH

