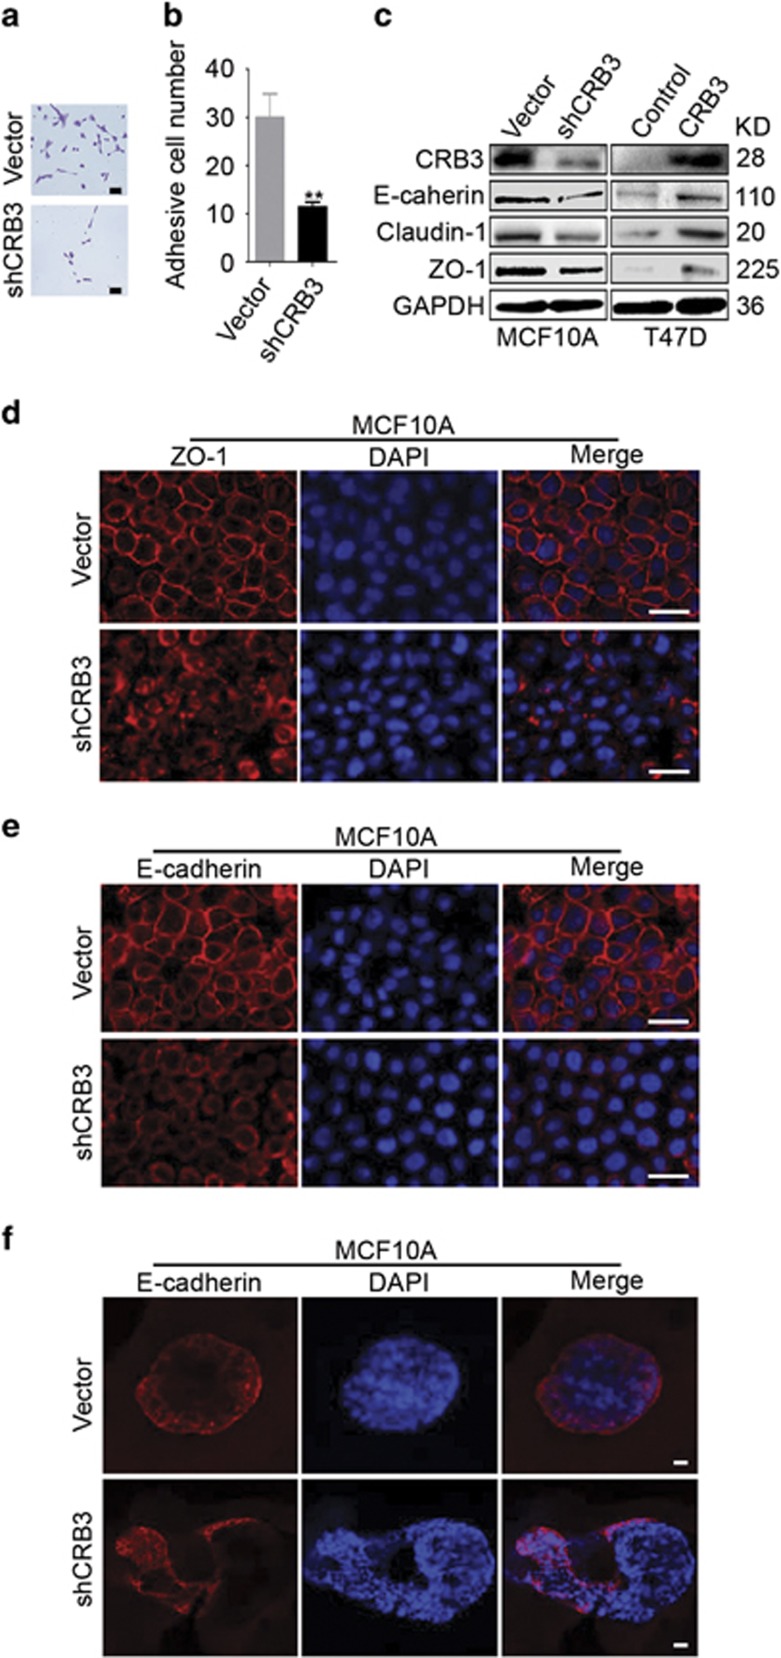
Figure 3.
The loss of CRB3 disrupts the formation of tight and adherens junctions. (a, b) A cell adhesion assay was performed to detect the adhesion of MCF10A cells. Scale bar, 50 μm **P<0.01. Data are mean±S.D. (c) The levels of the ZO-1, Claudin-1 and E-cadherin proteins were determined by immunoblotting. (d, e) The localization of ZO-1 and E-cadherin was examined in MCF10A cells grown in 2D culture. Scale bar, 25 μm. (f) The localization of E-cadherin in 3D cultures was detected using immunofluorescence staining. Scale bar, 25 μm

